Integration with Prometheus #
Infini Gateway supports outputting metrics in Prometheus format, which is convenient for integration with Prometheus.
Stats API #
Access Gateway’s API endpoint, with URL parameter as below:
http://localhost:2900/stats?format=prometheus
➜  ~ curl http://localhost:2900/stats\?format\=prometheus
buffer_fasthttp_resbody_buffer_acquired{type="gateway", ip="192.168.3.23", name="Orchid", id="cbvjphrq50kcnsu2a8v0"} 1
buffer_stats_acquired{type="gateway", ip="192.168.3.23", name="Orchid", id="cbvjphrq50kcnsu2a8v0"} 7
buffer_stats_max_count{type="gateway", ip="192.168.3.23", name="Orchid", id="cbvjphrq50kcnsu2a8v0"} 0
system_cpu{type="gateway", ip="192.168.3.23", name="Orchid", id="cbvjphrq50kcnsu2a8v0"} 0
buffer_bulk_request_docs_acquired{type="gateway", ip="192.168.3.23", name="Orchid", id="cbvjphrq50kcnsu2a8v0"} 1
buffer_fasthttp_resbody_buffer_inuse{type="gateway", ip="192.168.3.23", name="Orchid", id="cbvjphrq50kcnsu2a8v0"} 0
stats_gateway_request_bytes{type="gateway", ip="192.168.3.23", name="Orchid", id="cbvjphrq50kcnsu2a8v0"} 0
system_mem{type="gateway", ip="192.168.3.23", name="Orchid", id="cbvjphrq50kcnsu2a8v0"} 31473664
...
By providing parameter format=prometheus, the Prometheus format will be outputted.
Configure Prometheus #
Edit config file: prometheus.yml
# my global config
global:
  scrape_interval: 15s # Set the scrape interval to every 15 seconds. Default is every 1 minute.
  evaluation_interval: 15s # Evaluate rules every 15 seconds. The default is every 1 minute.
  # scrape_timeout is set to the global default (10s).

# Alertmanager configuration
alerting:
  alertmanagers:
    - static_configs:
        - targets:
          # - alertmanager:9093

# Load rules once and periodically evaluate them according to the global 'evaluation_interval'.
rule_files:
  # - "first_rules.yml"
  # - "second_rules.yml"

# A scrape configuration containing exactly one endpoint to scrape:
# Here it's Prometheus itself.
scrape_configs:
  - job_name: "prometheus"
    scrape_interval: 5s
    # metrics_path defaults to '/metrics'
    metrics_path: /stats
    params:
      format: ['prometheus']
    # scheme defaults to 'http'.
    static_configs:
      - targets: ["localhost:2900"]
        labels:
          group: 'infini'
Start Prometheus #
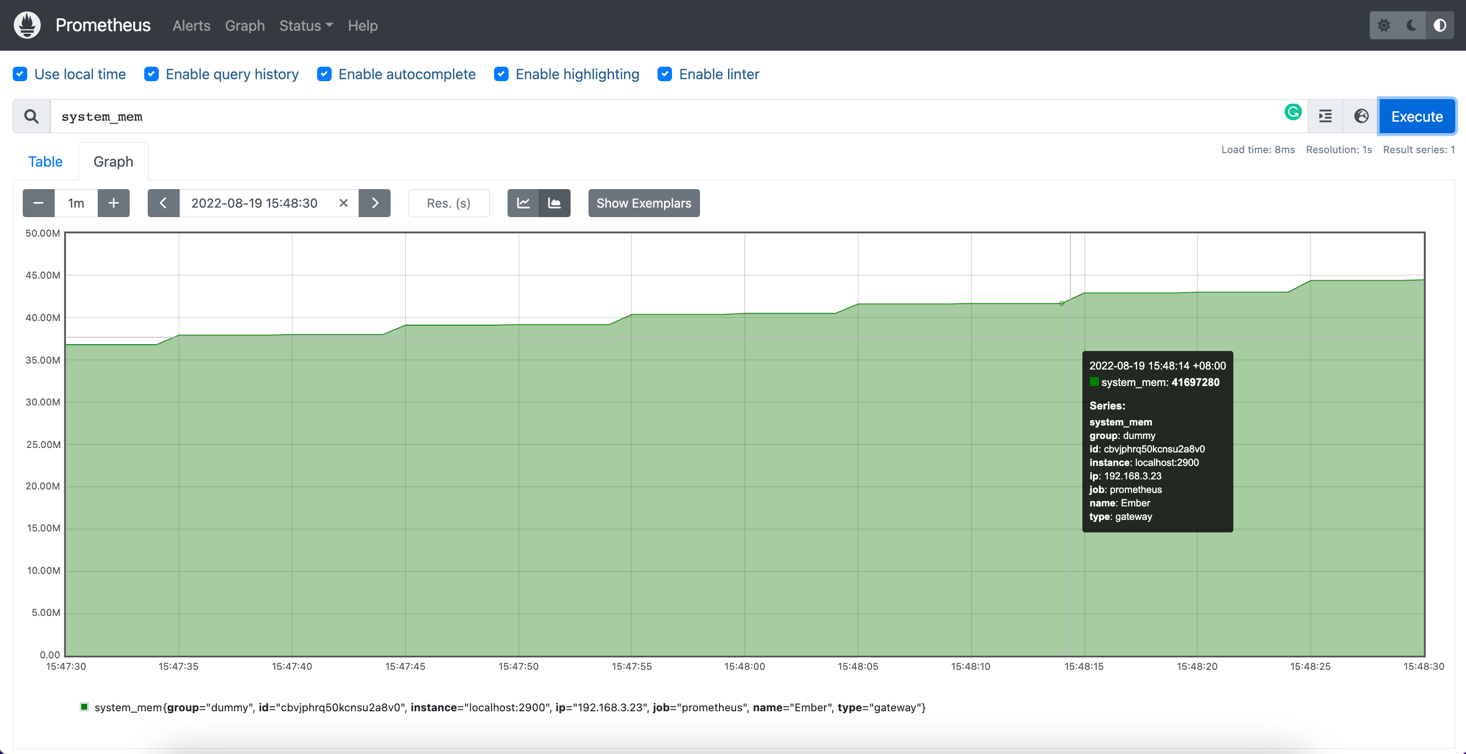
The metrics success scraped.

Then you can continuously check the running status of the gateway.
