Cluster Monitoring #
Introduction #
When the monitoring of the registered cluster is enabled, the INFINI Console will periodically collect data from the target cluster according to the corresponding configuration.
Including some metrics at the cluster, node, and index level. These metrics can then be observed in cluster monitoring to understand the running status of the target cluster.
List of Elasticsearch API permissions required for monitoring :
- _cluster/health
- _cluster/stats
- _cat/shards
- _nodes/<node_id>/stats
- _cat/indices
- _stats
- _cluster/state
- _nodes
- _alias
- _cluster/settings
Enable Cluster Monitoring #
When registering the cluster or modifying the cluster configuration, you can see the following interface
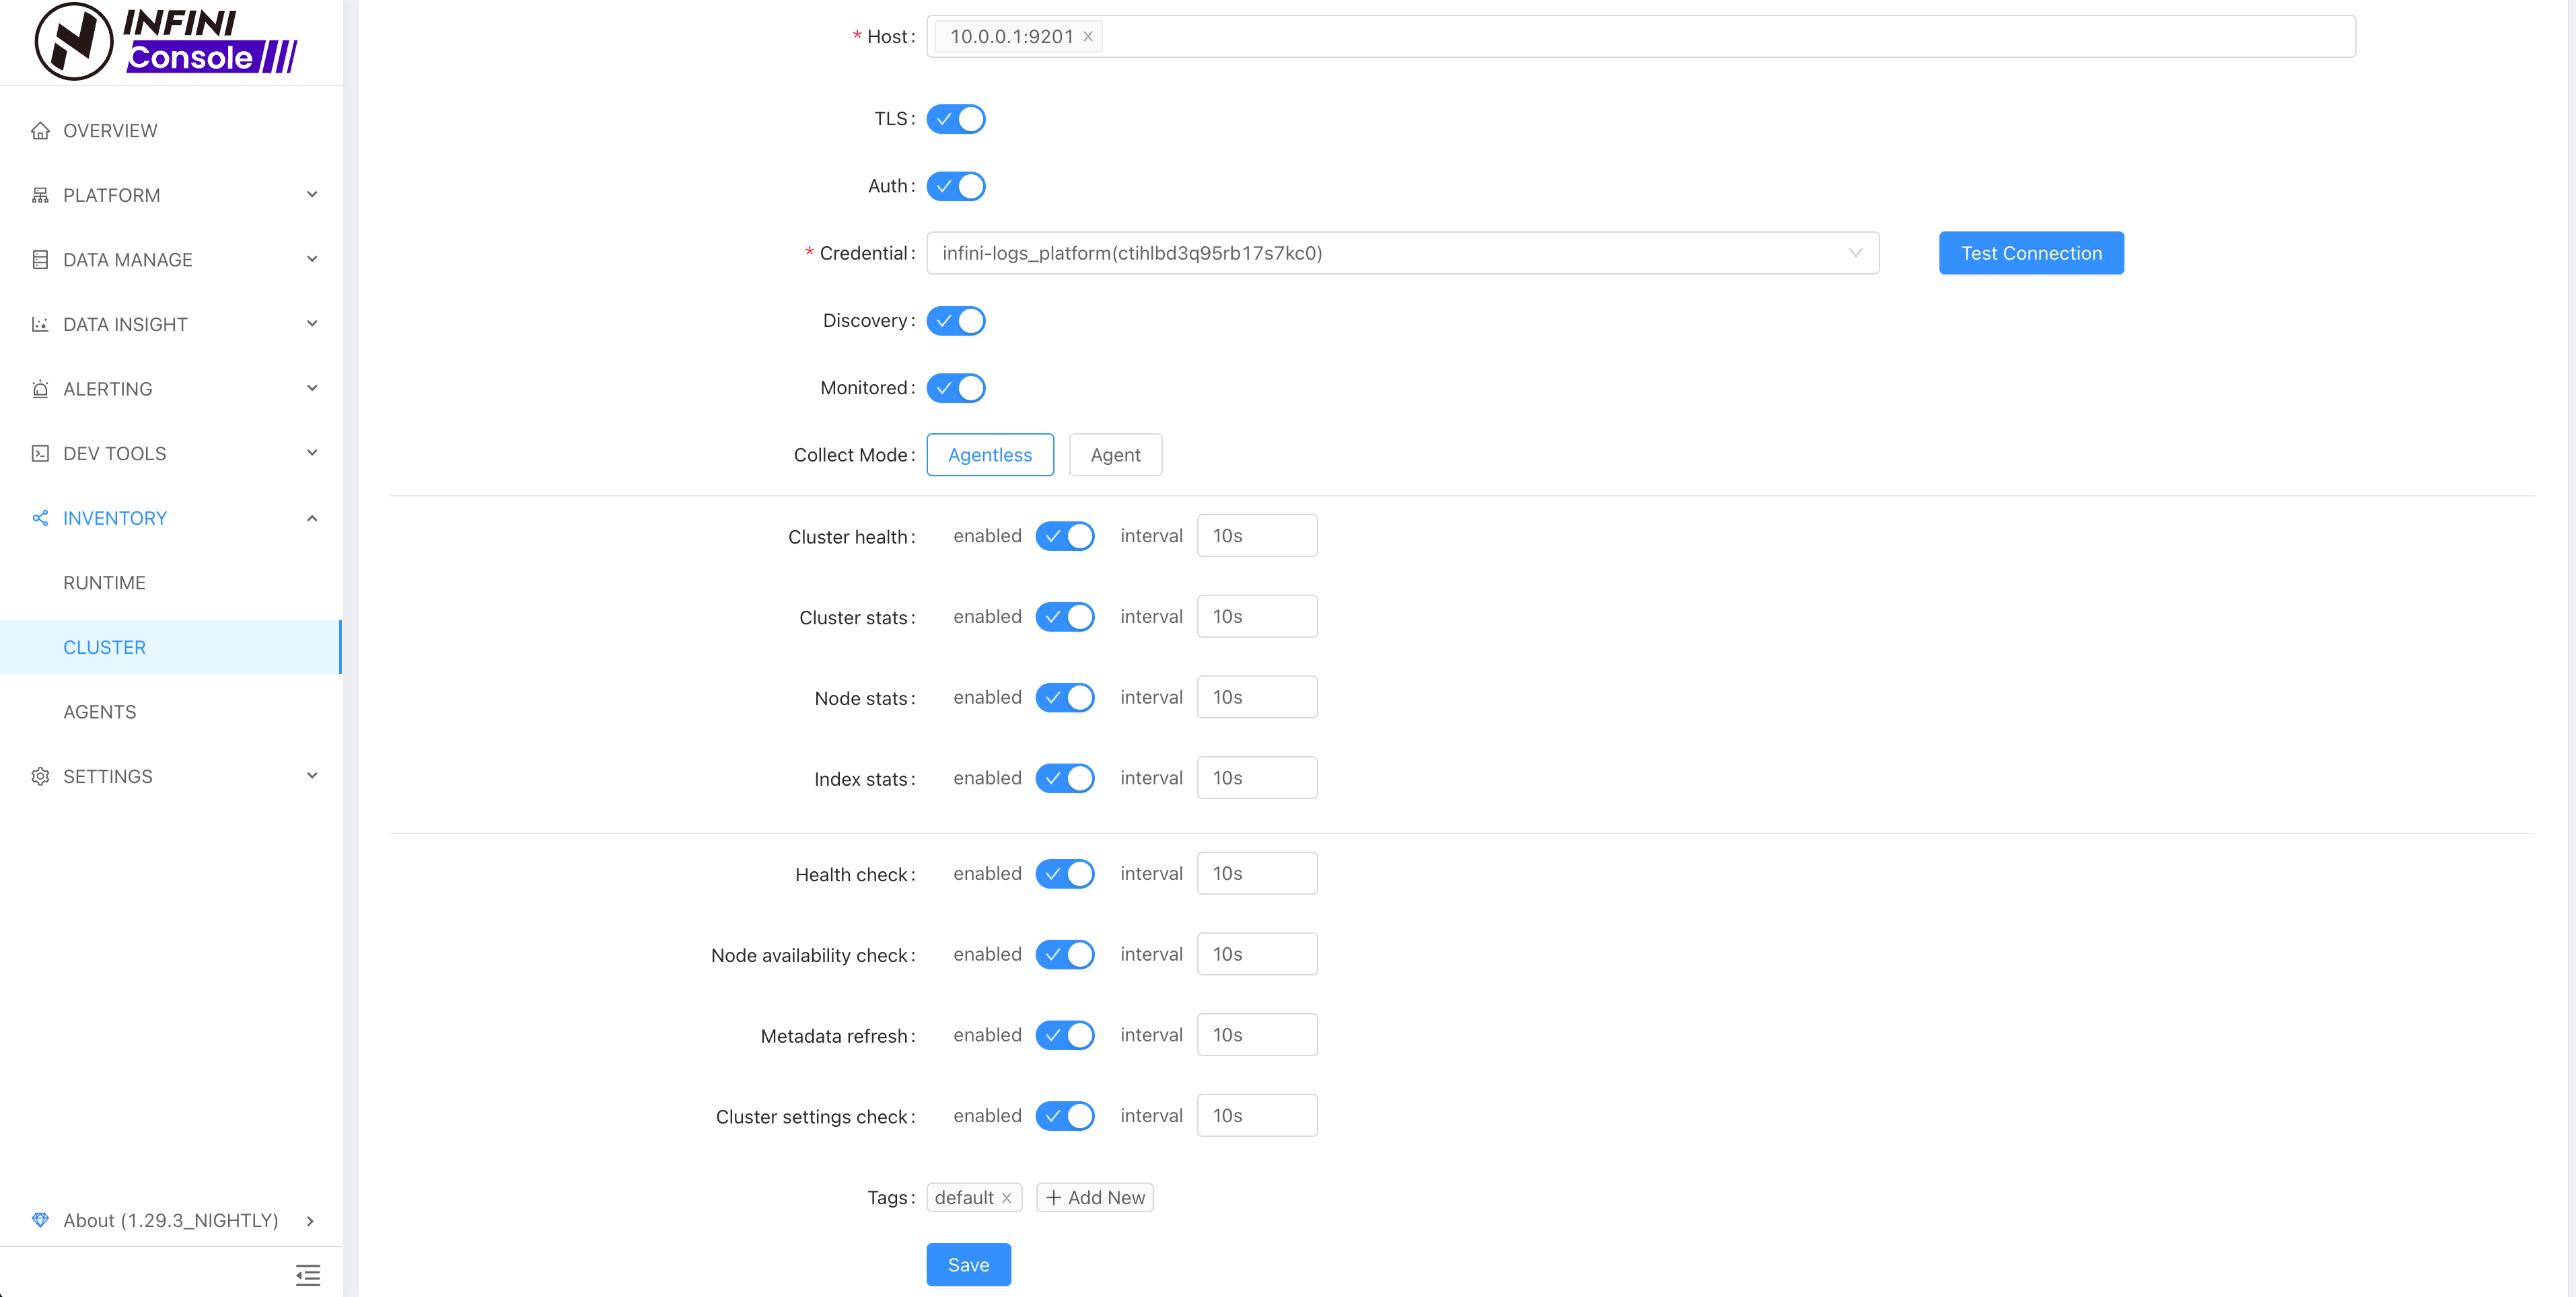
You can see that there is a Monitored switch. When this switch is turned on, it means that the current cluster is monitored.
When a cluster is registered, monitoring is enabled by default. The monitoring configuration includes cluster health metrics, cluster metrics, node metrics and index metrics.
And you can set whether to open and the collection time interval respectively.
The above are the settings for a single cluster. In the configuration file
console.yaml, you can set the monitoring start and stop of all clusters. By default, you can see the following configuration in the configuration file:metrics: enabled: true major_ip_pattern: "192.*" queue: metrics elasticsearch: enabled: true cluster_stats: true node_stats: true index_stats: trueIf
metrics>enableis set to false, then all cluster monitoring is disabled; Ifmetrics>elasticsearch>cluster_stats>enabledis set tofalse, then all The cluster will not collect related metrics at the cluster level.
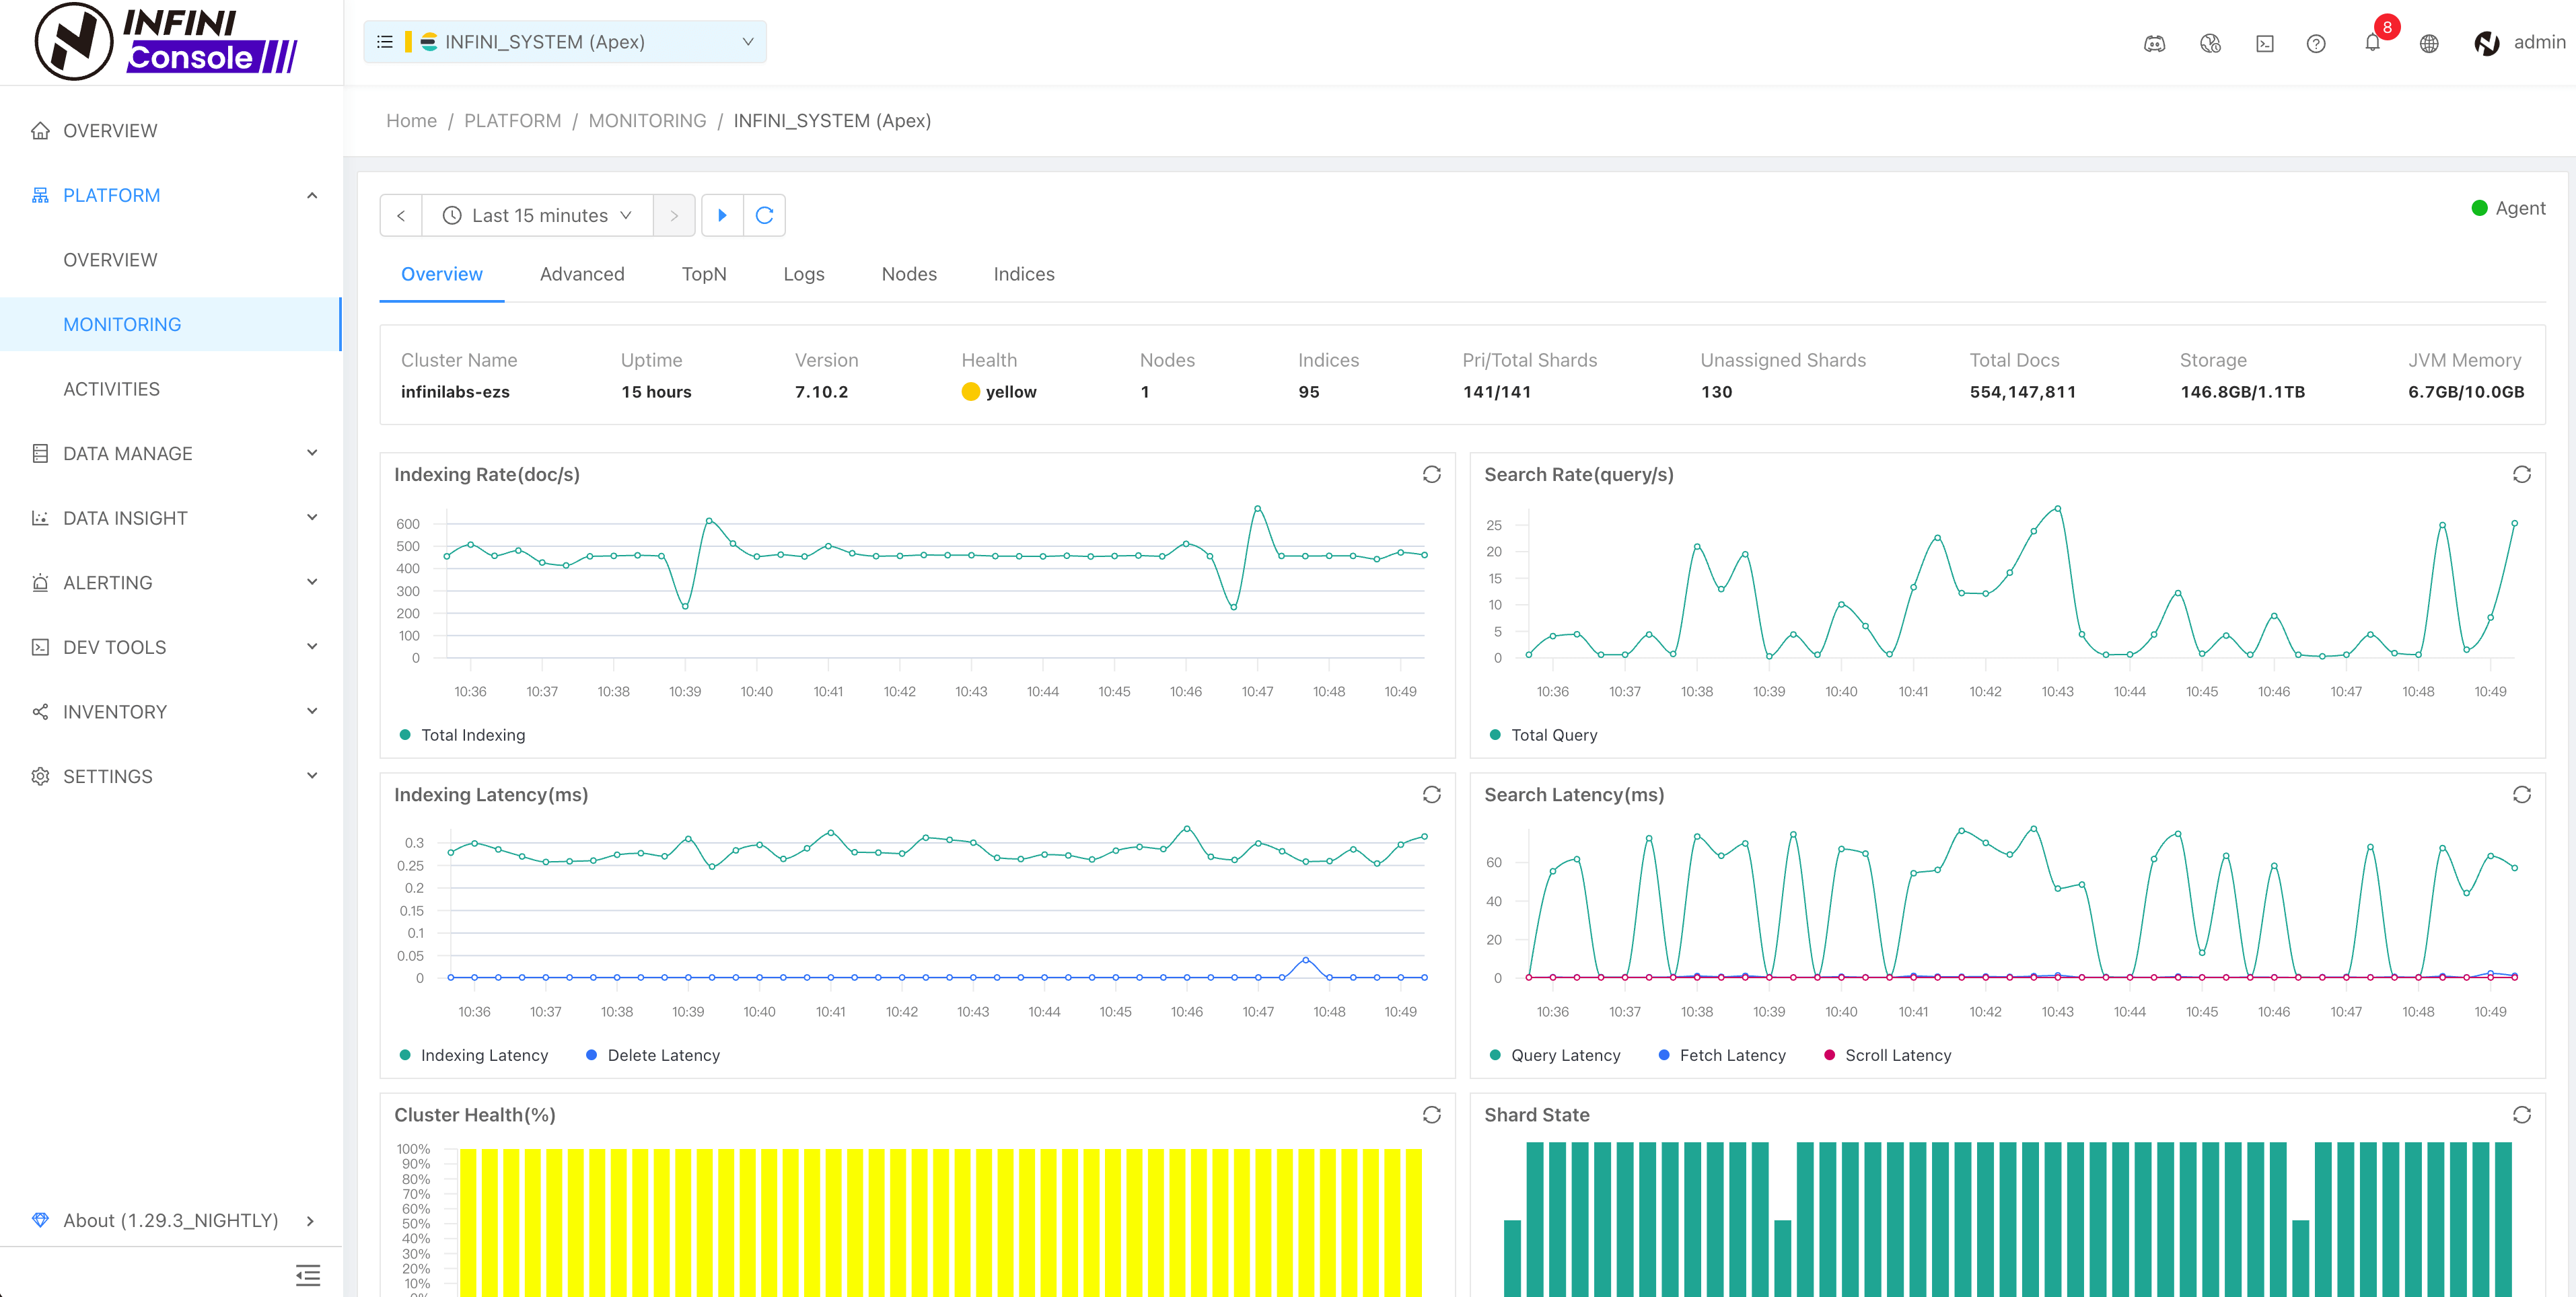
View Cluster Metrics #
After monitoring is enabled, you can view the monitoring information of the cluster in the monitoring report under the platform management on the left menu of INFINI Console, as follows:
Click the Advanced tab to view more metrics at the cluster level;
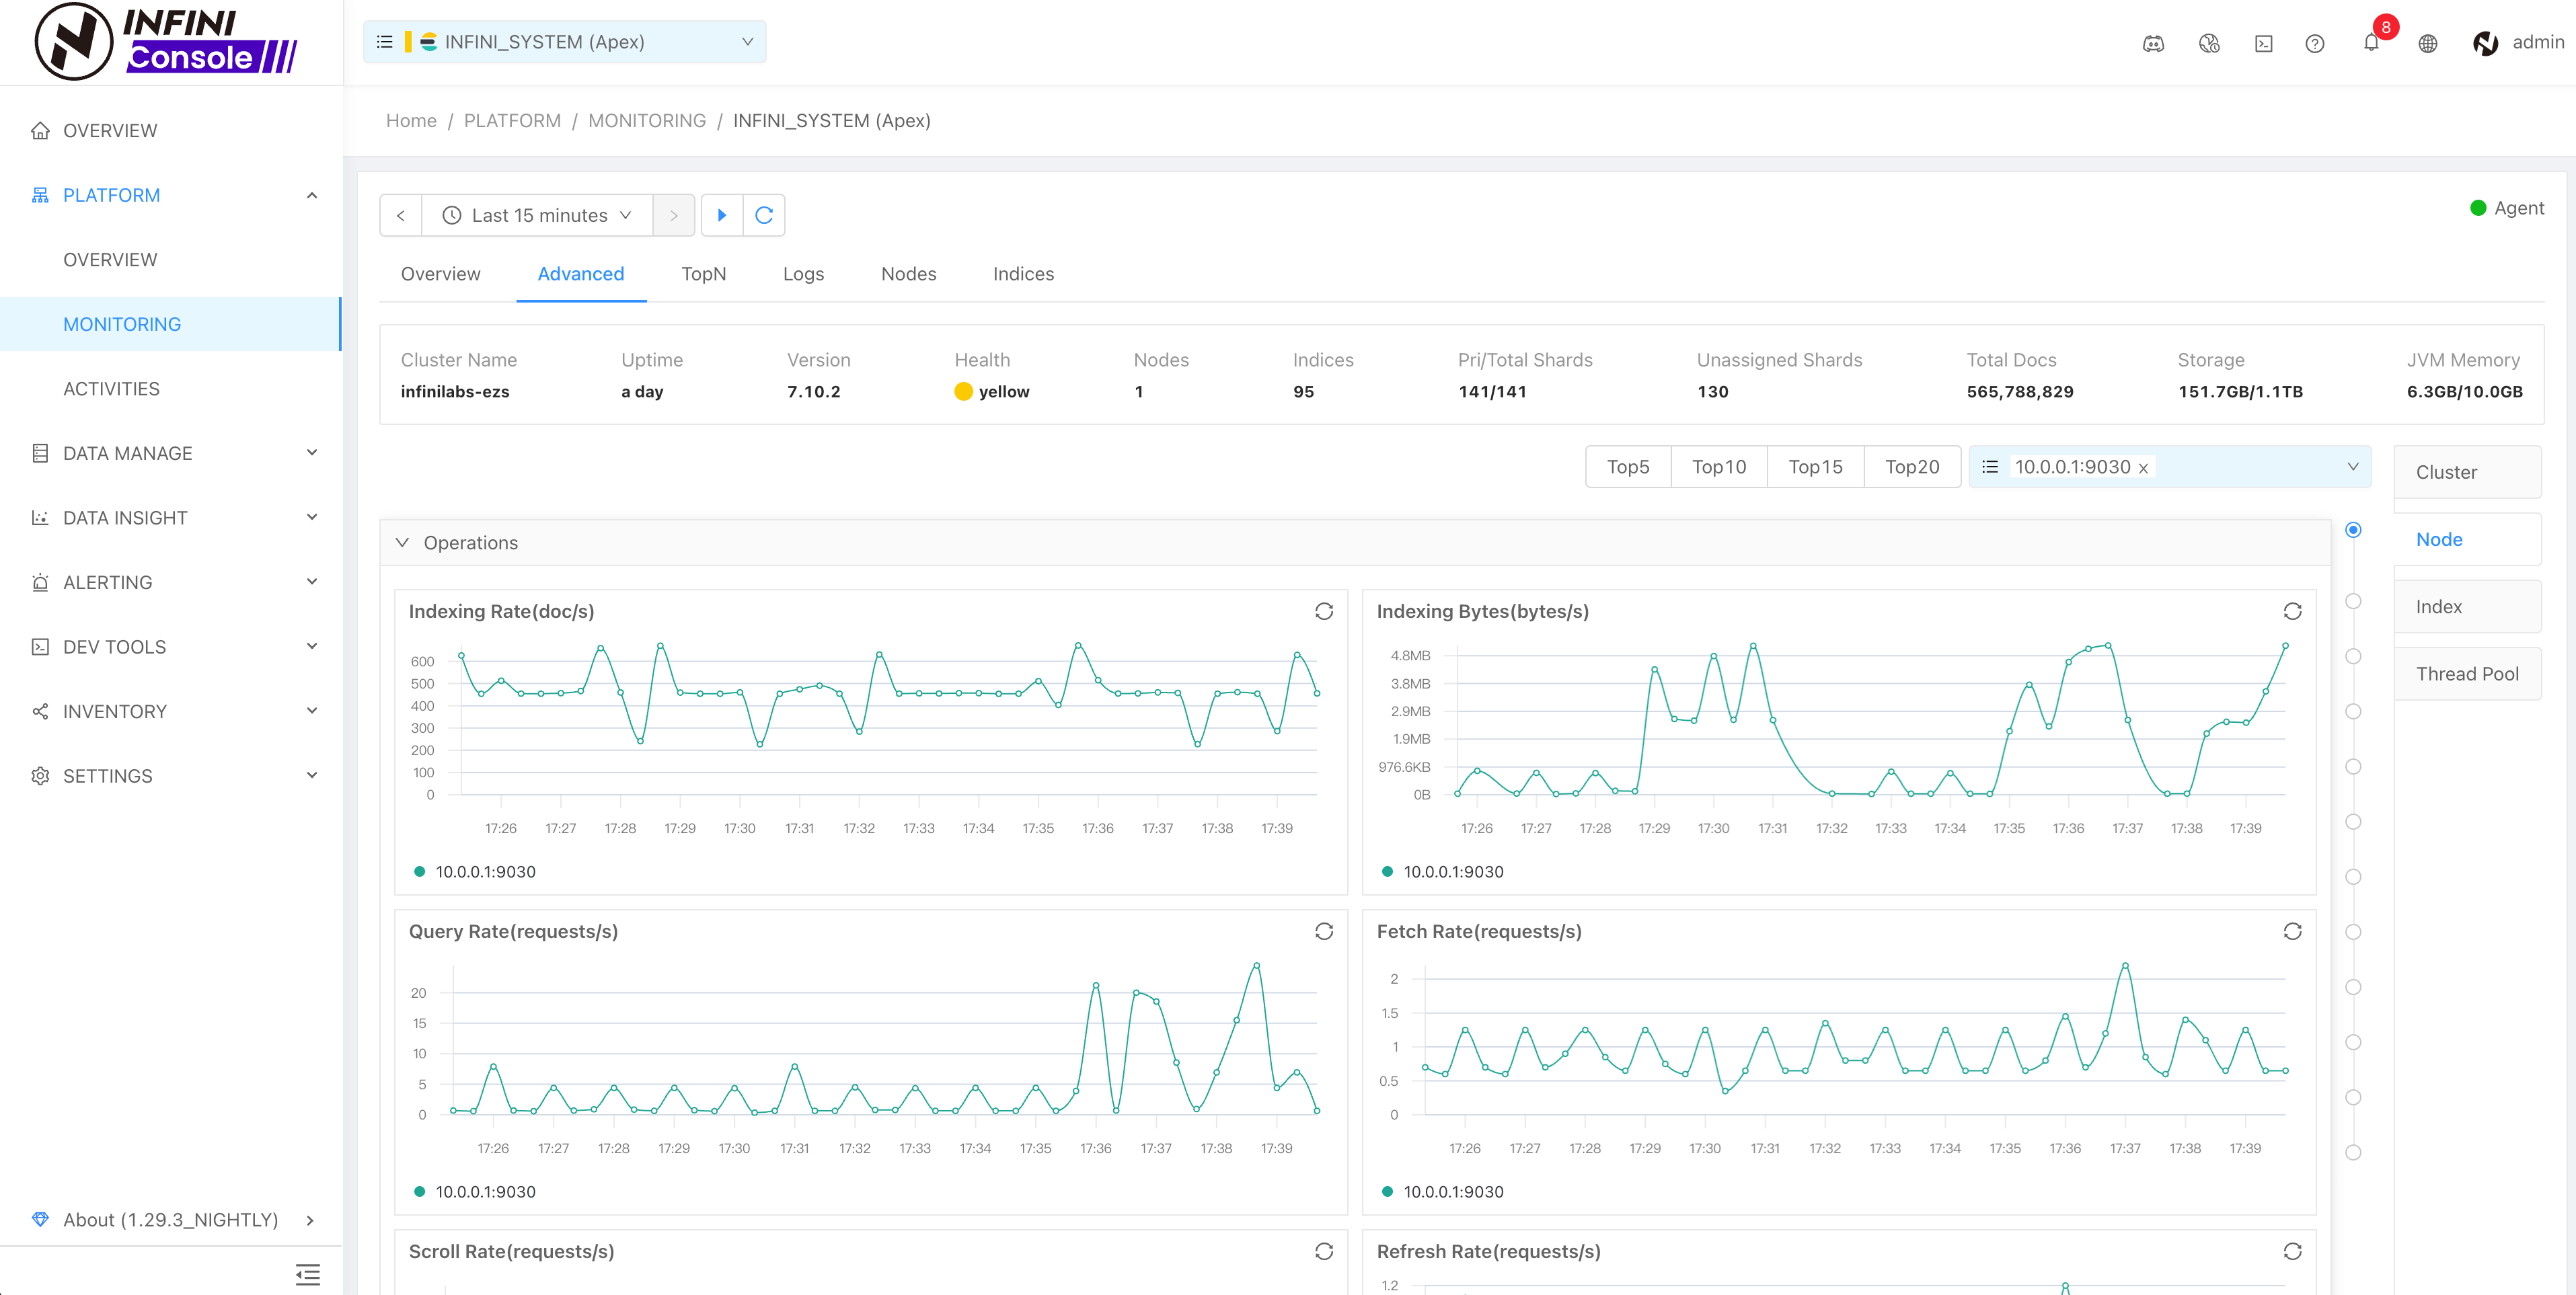
As shown in the figure, you can specify multiple nodes in a cluster to view node-related metrics and compare them horizontally. By default, the top 5 node metrics are displayed (top 5 nodes are calculated based on the sum of the query qps and write qps of the node in the last 15 minutes). Switching to the index tab page here can also specify several related metrics to view the index, similar to the node. Switch to the Thread Pool tab to view the related metrics of the node’s thread pool.
View Cluster TopN Metrics #
TopN is designed to quickly identify the top N key metric data points. With powerful multidimensional comparative analysis capabilities, it helps users optimize performance and make informed decisions more efficiently.
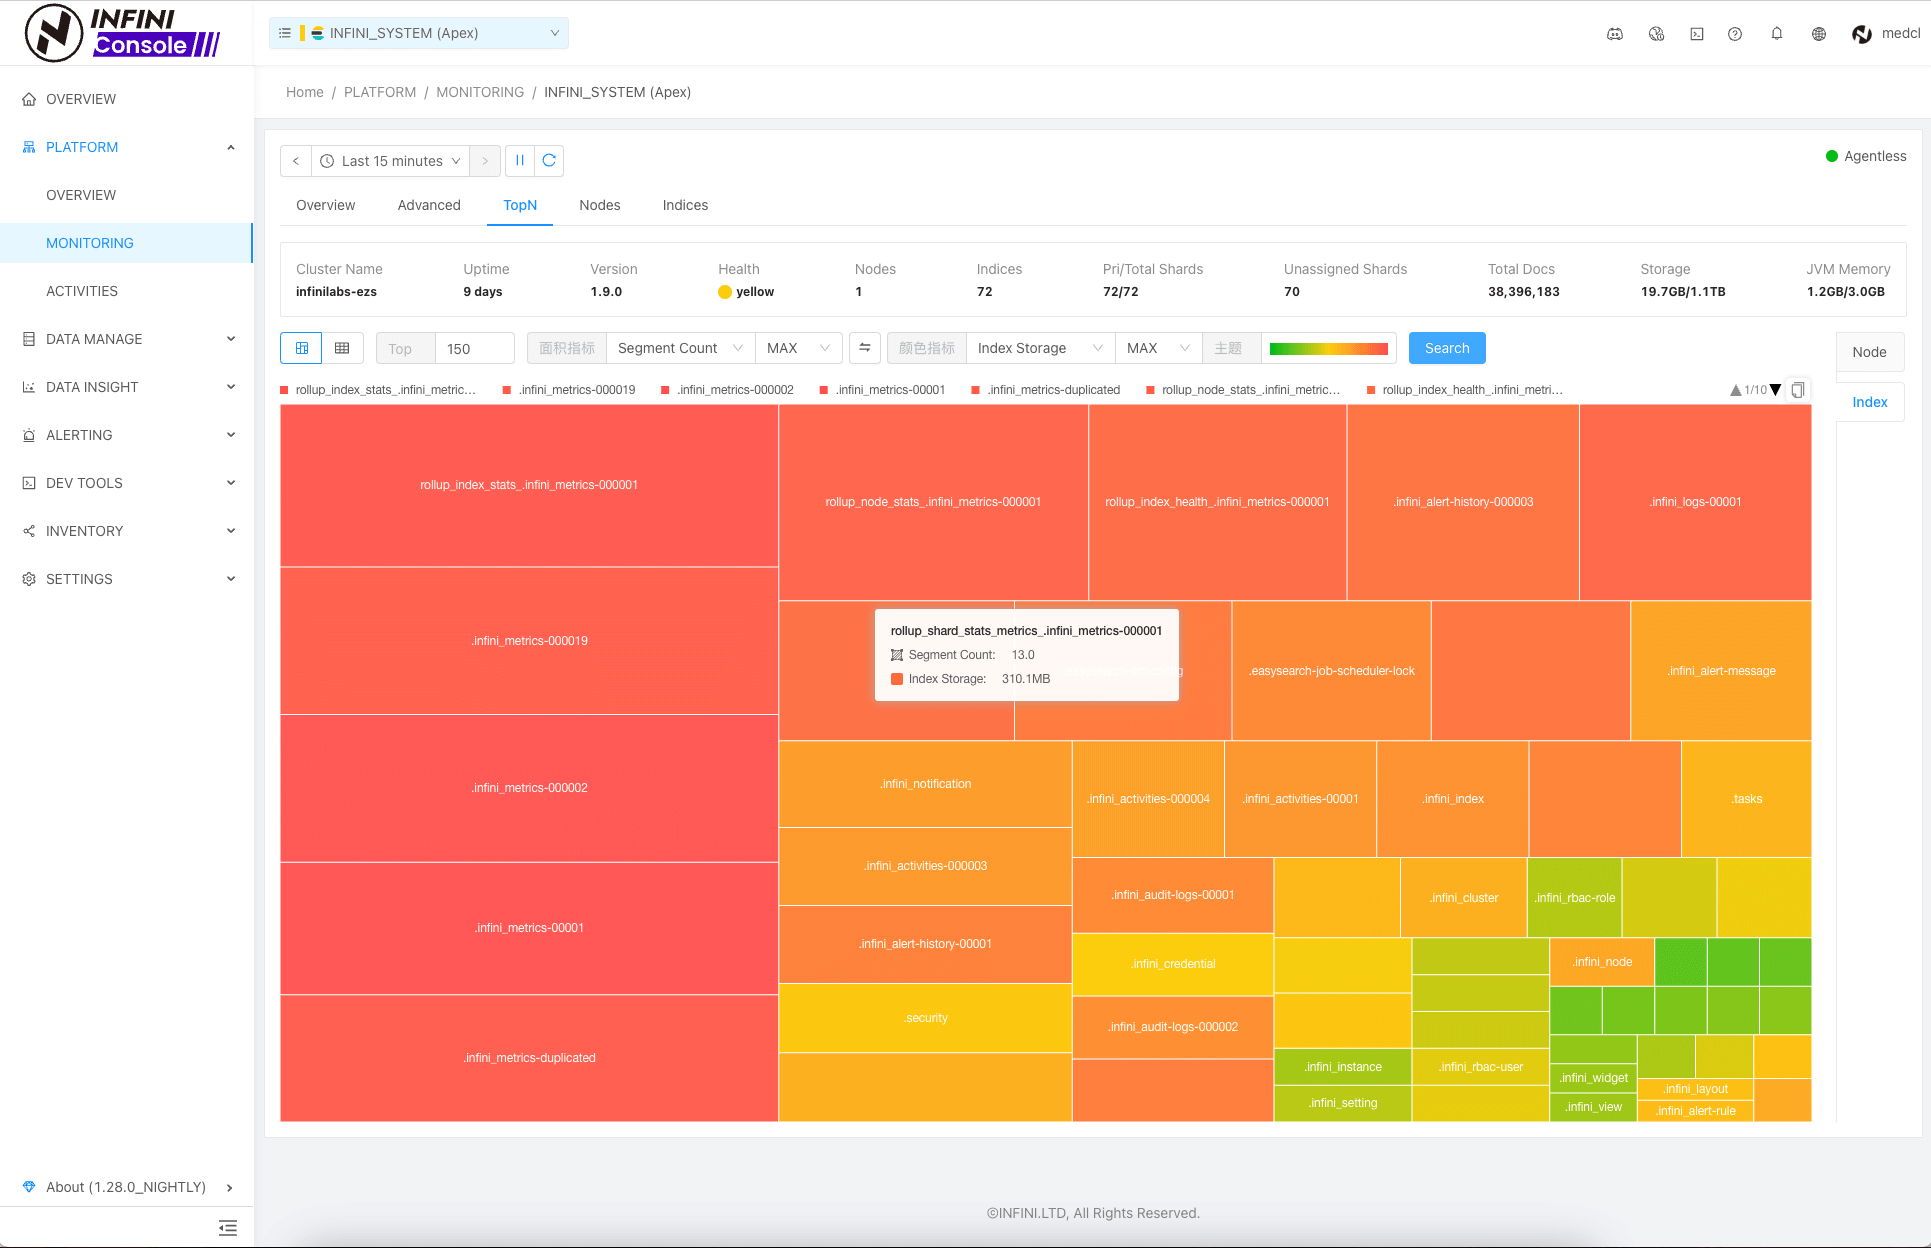
For detailed instructions on how to use TopN, please refer to this blog: Getting Started with the TopN Metrics Feature in INFINI Console
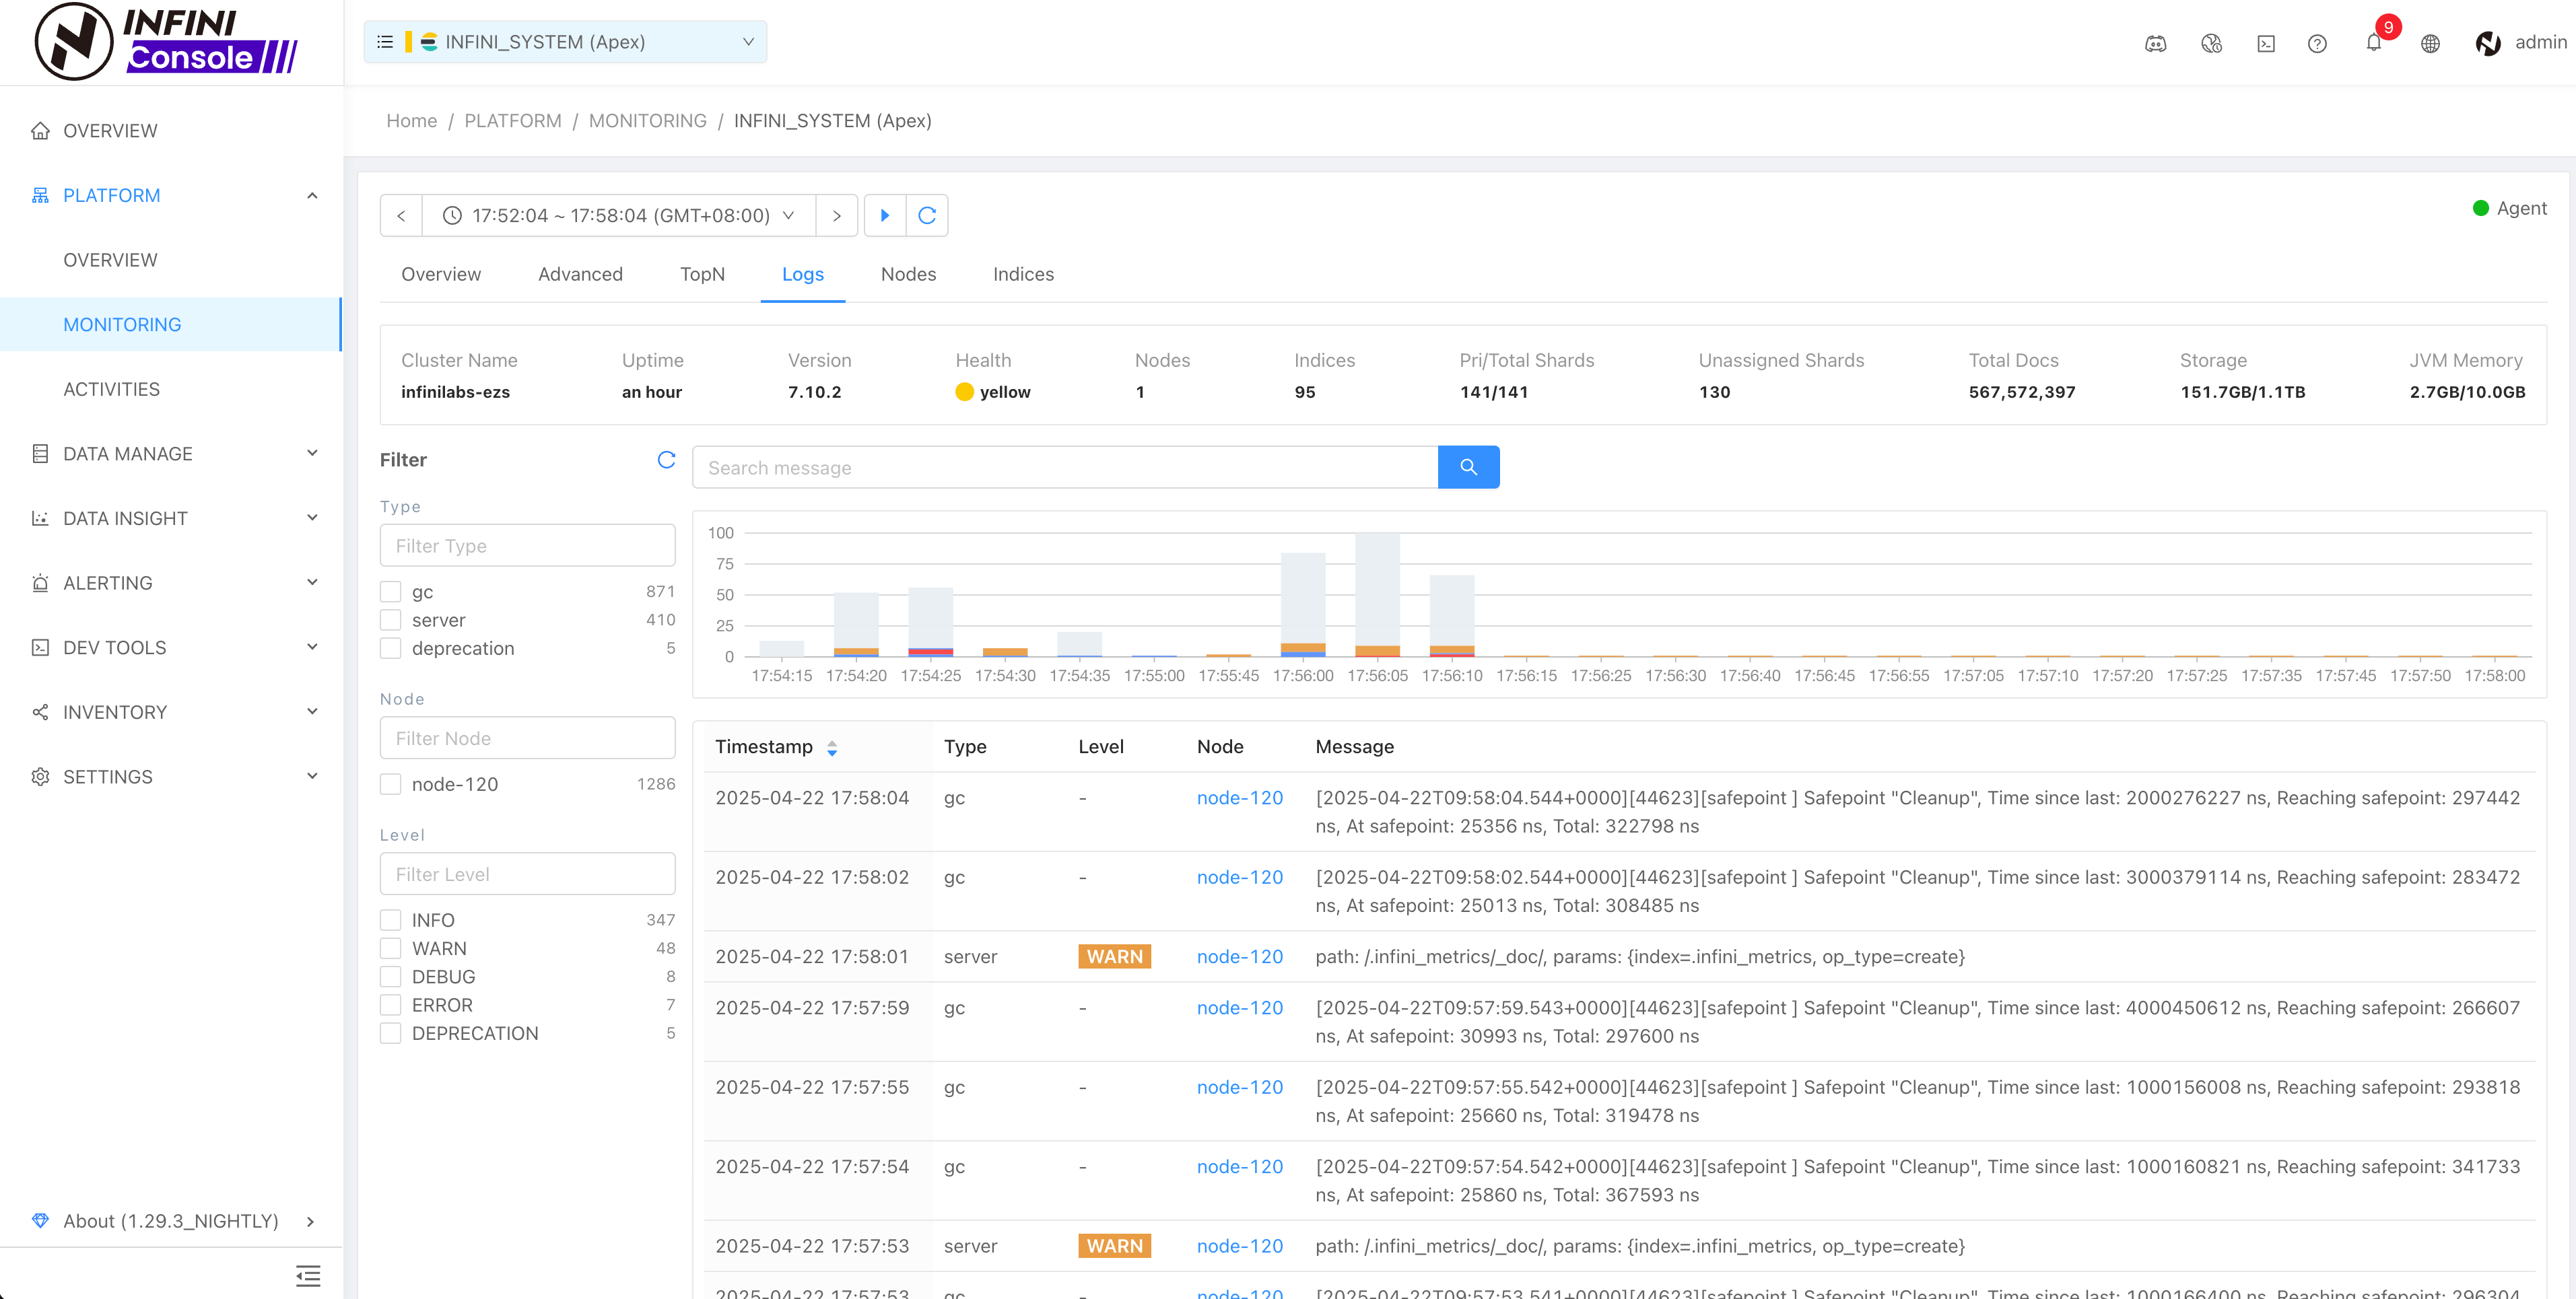
View Cluster Logs #
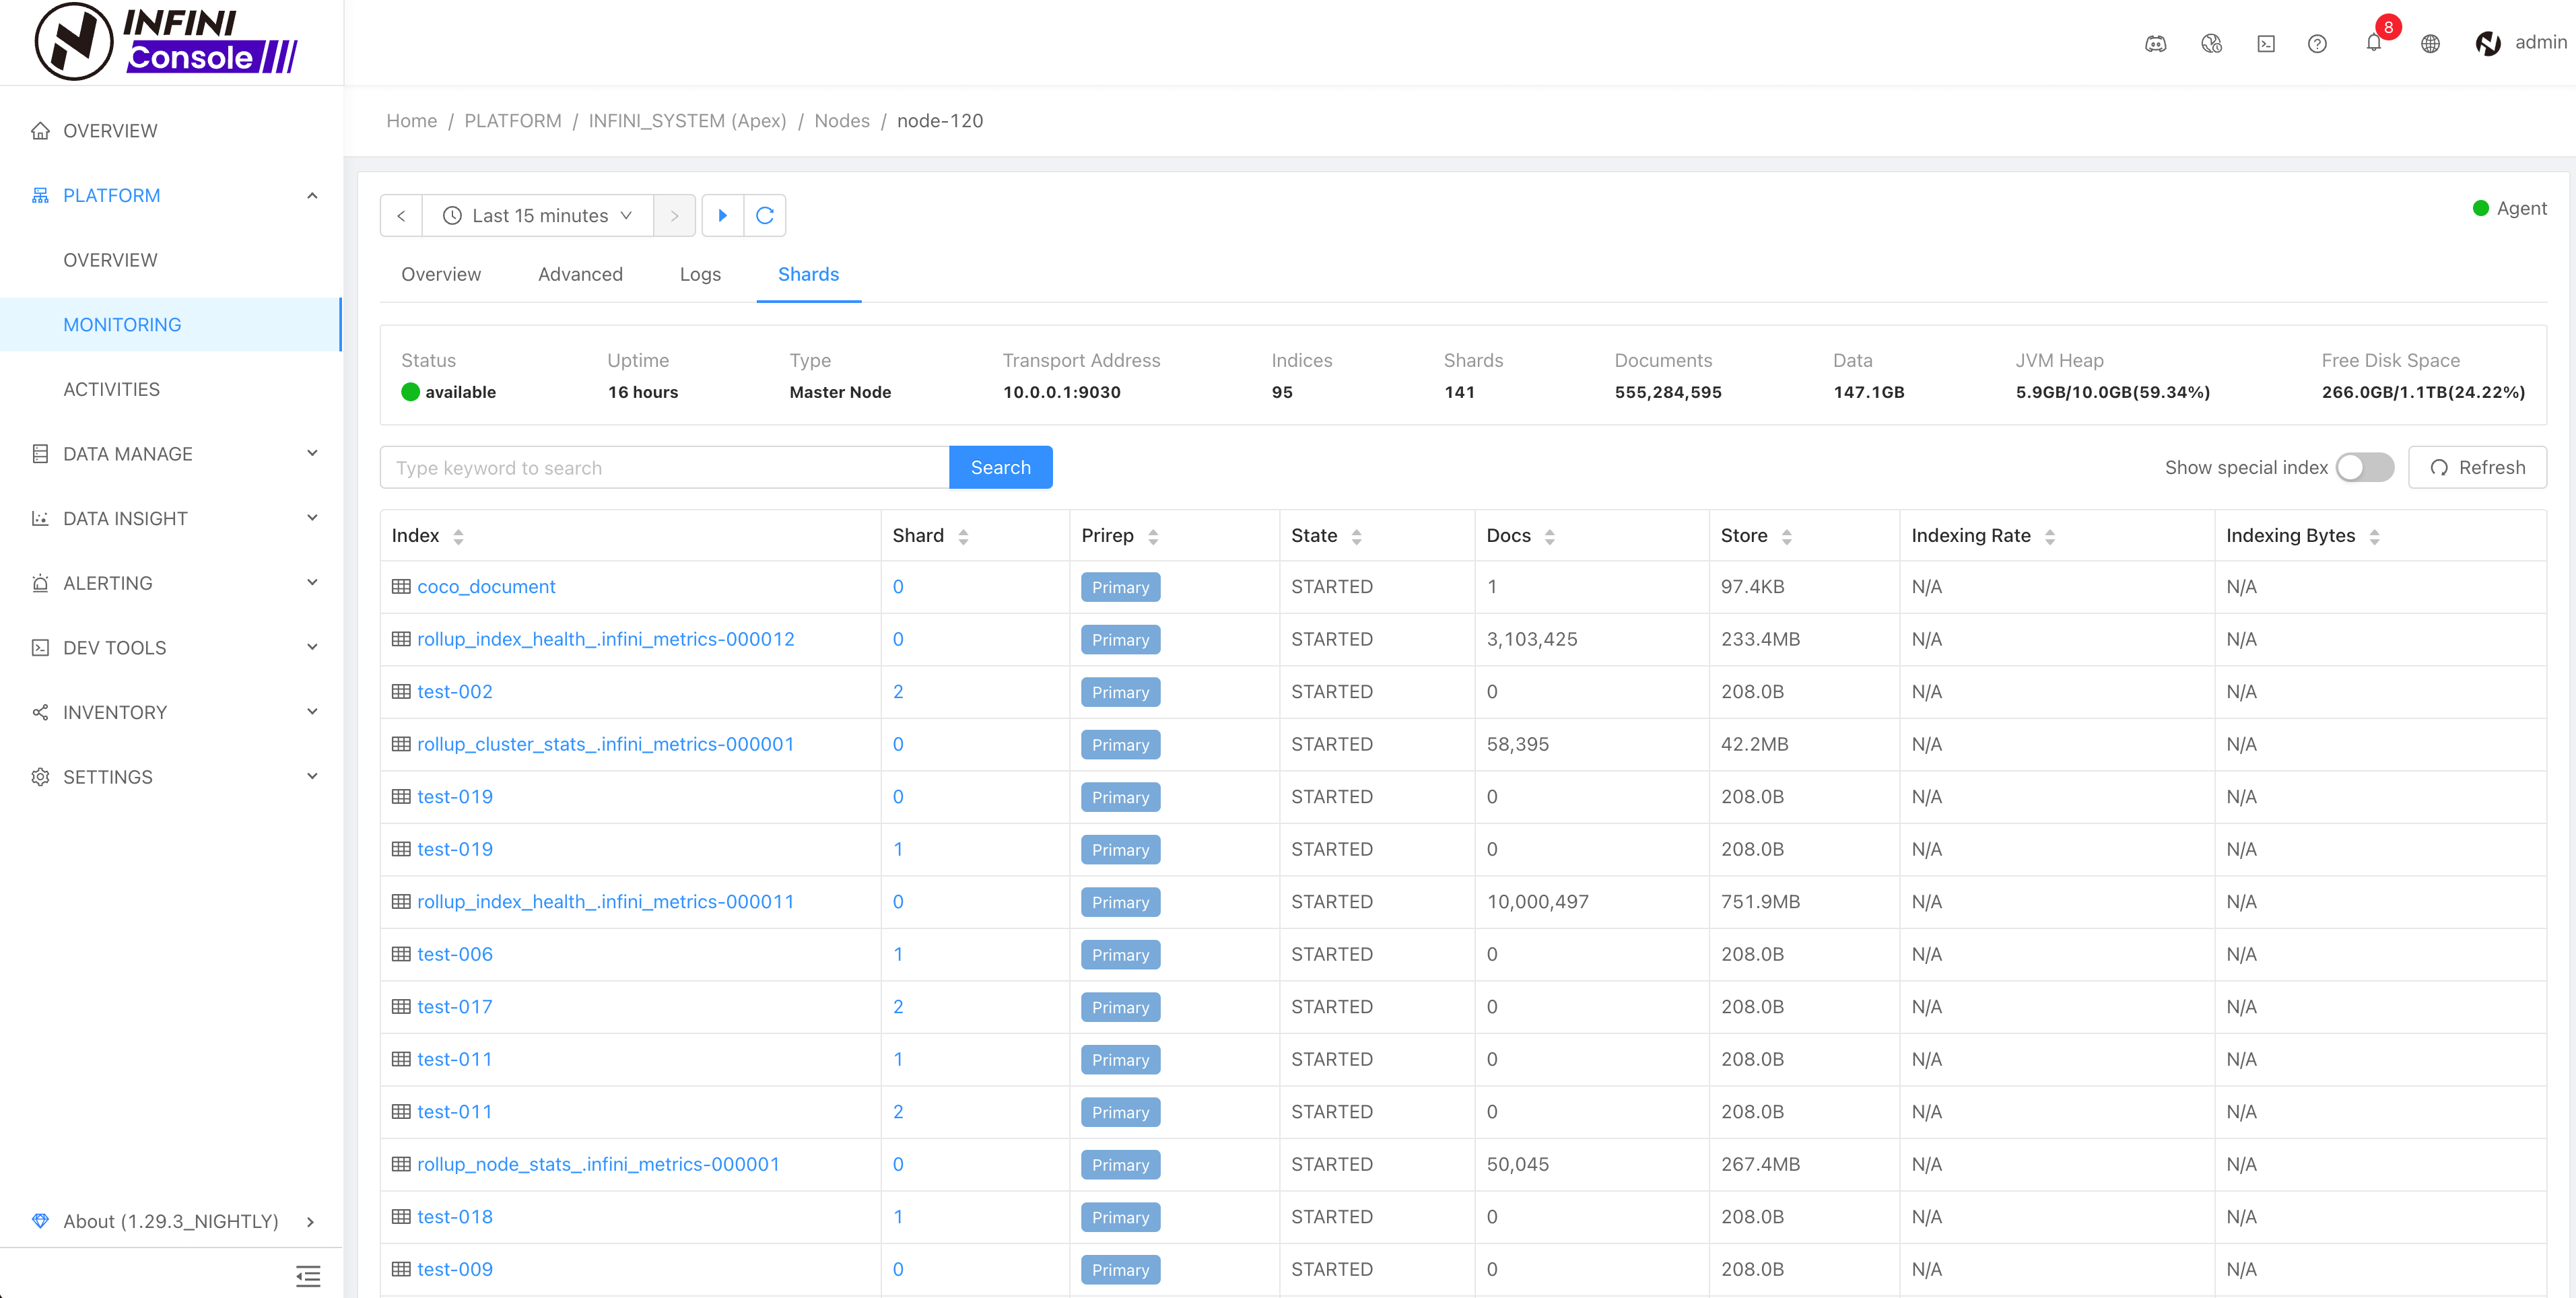
View Node Metrics #
Click the Nodes tab to view a list of cluster nodes.
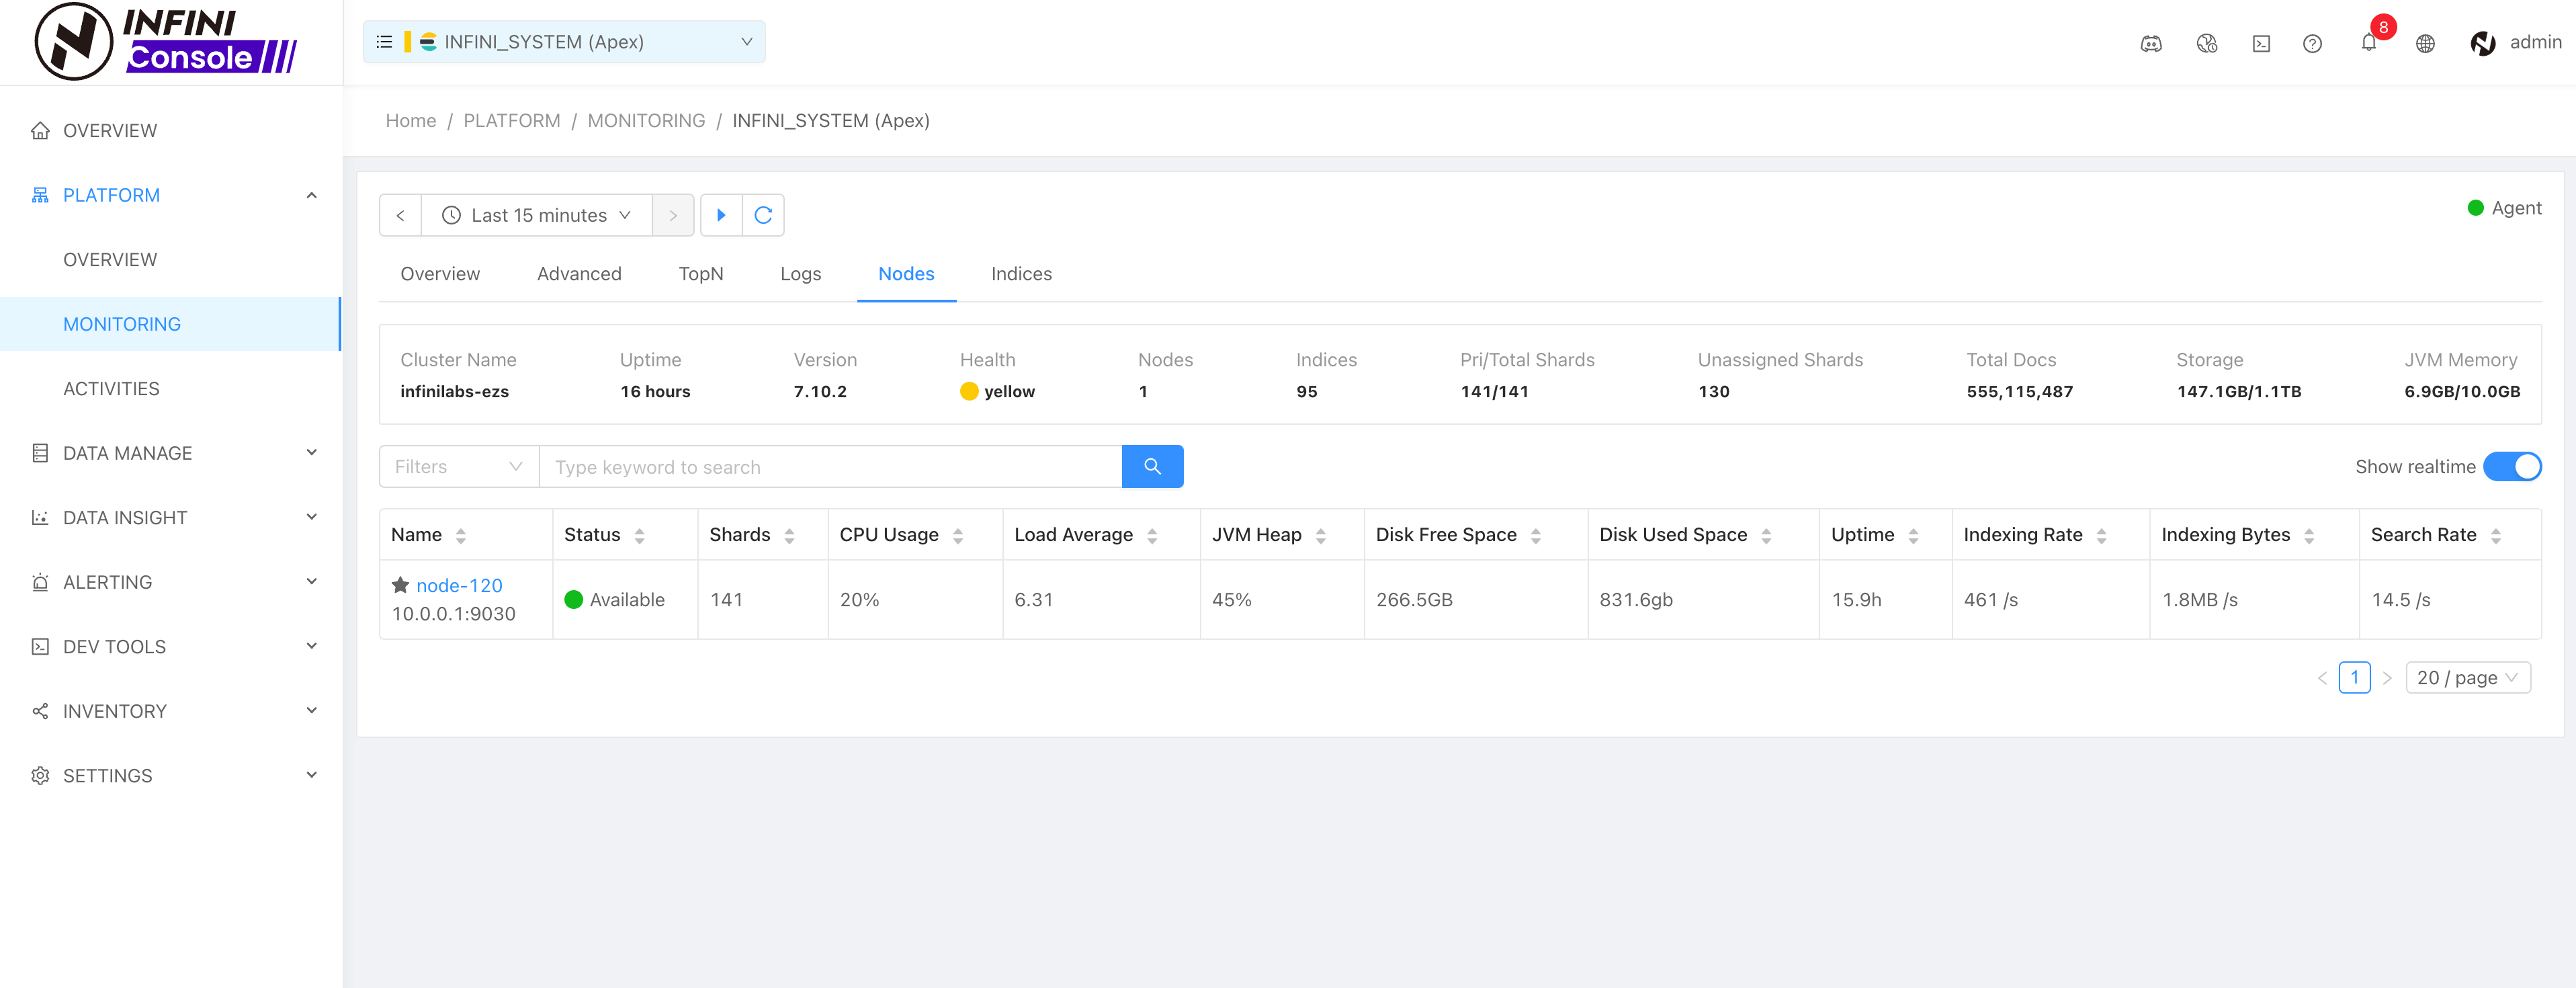
Click the node name in the list to view the monitoring of the specified node.
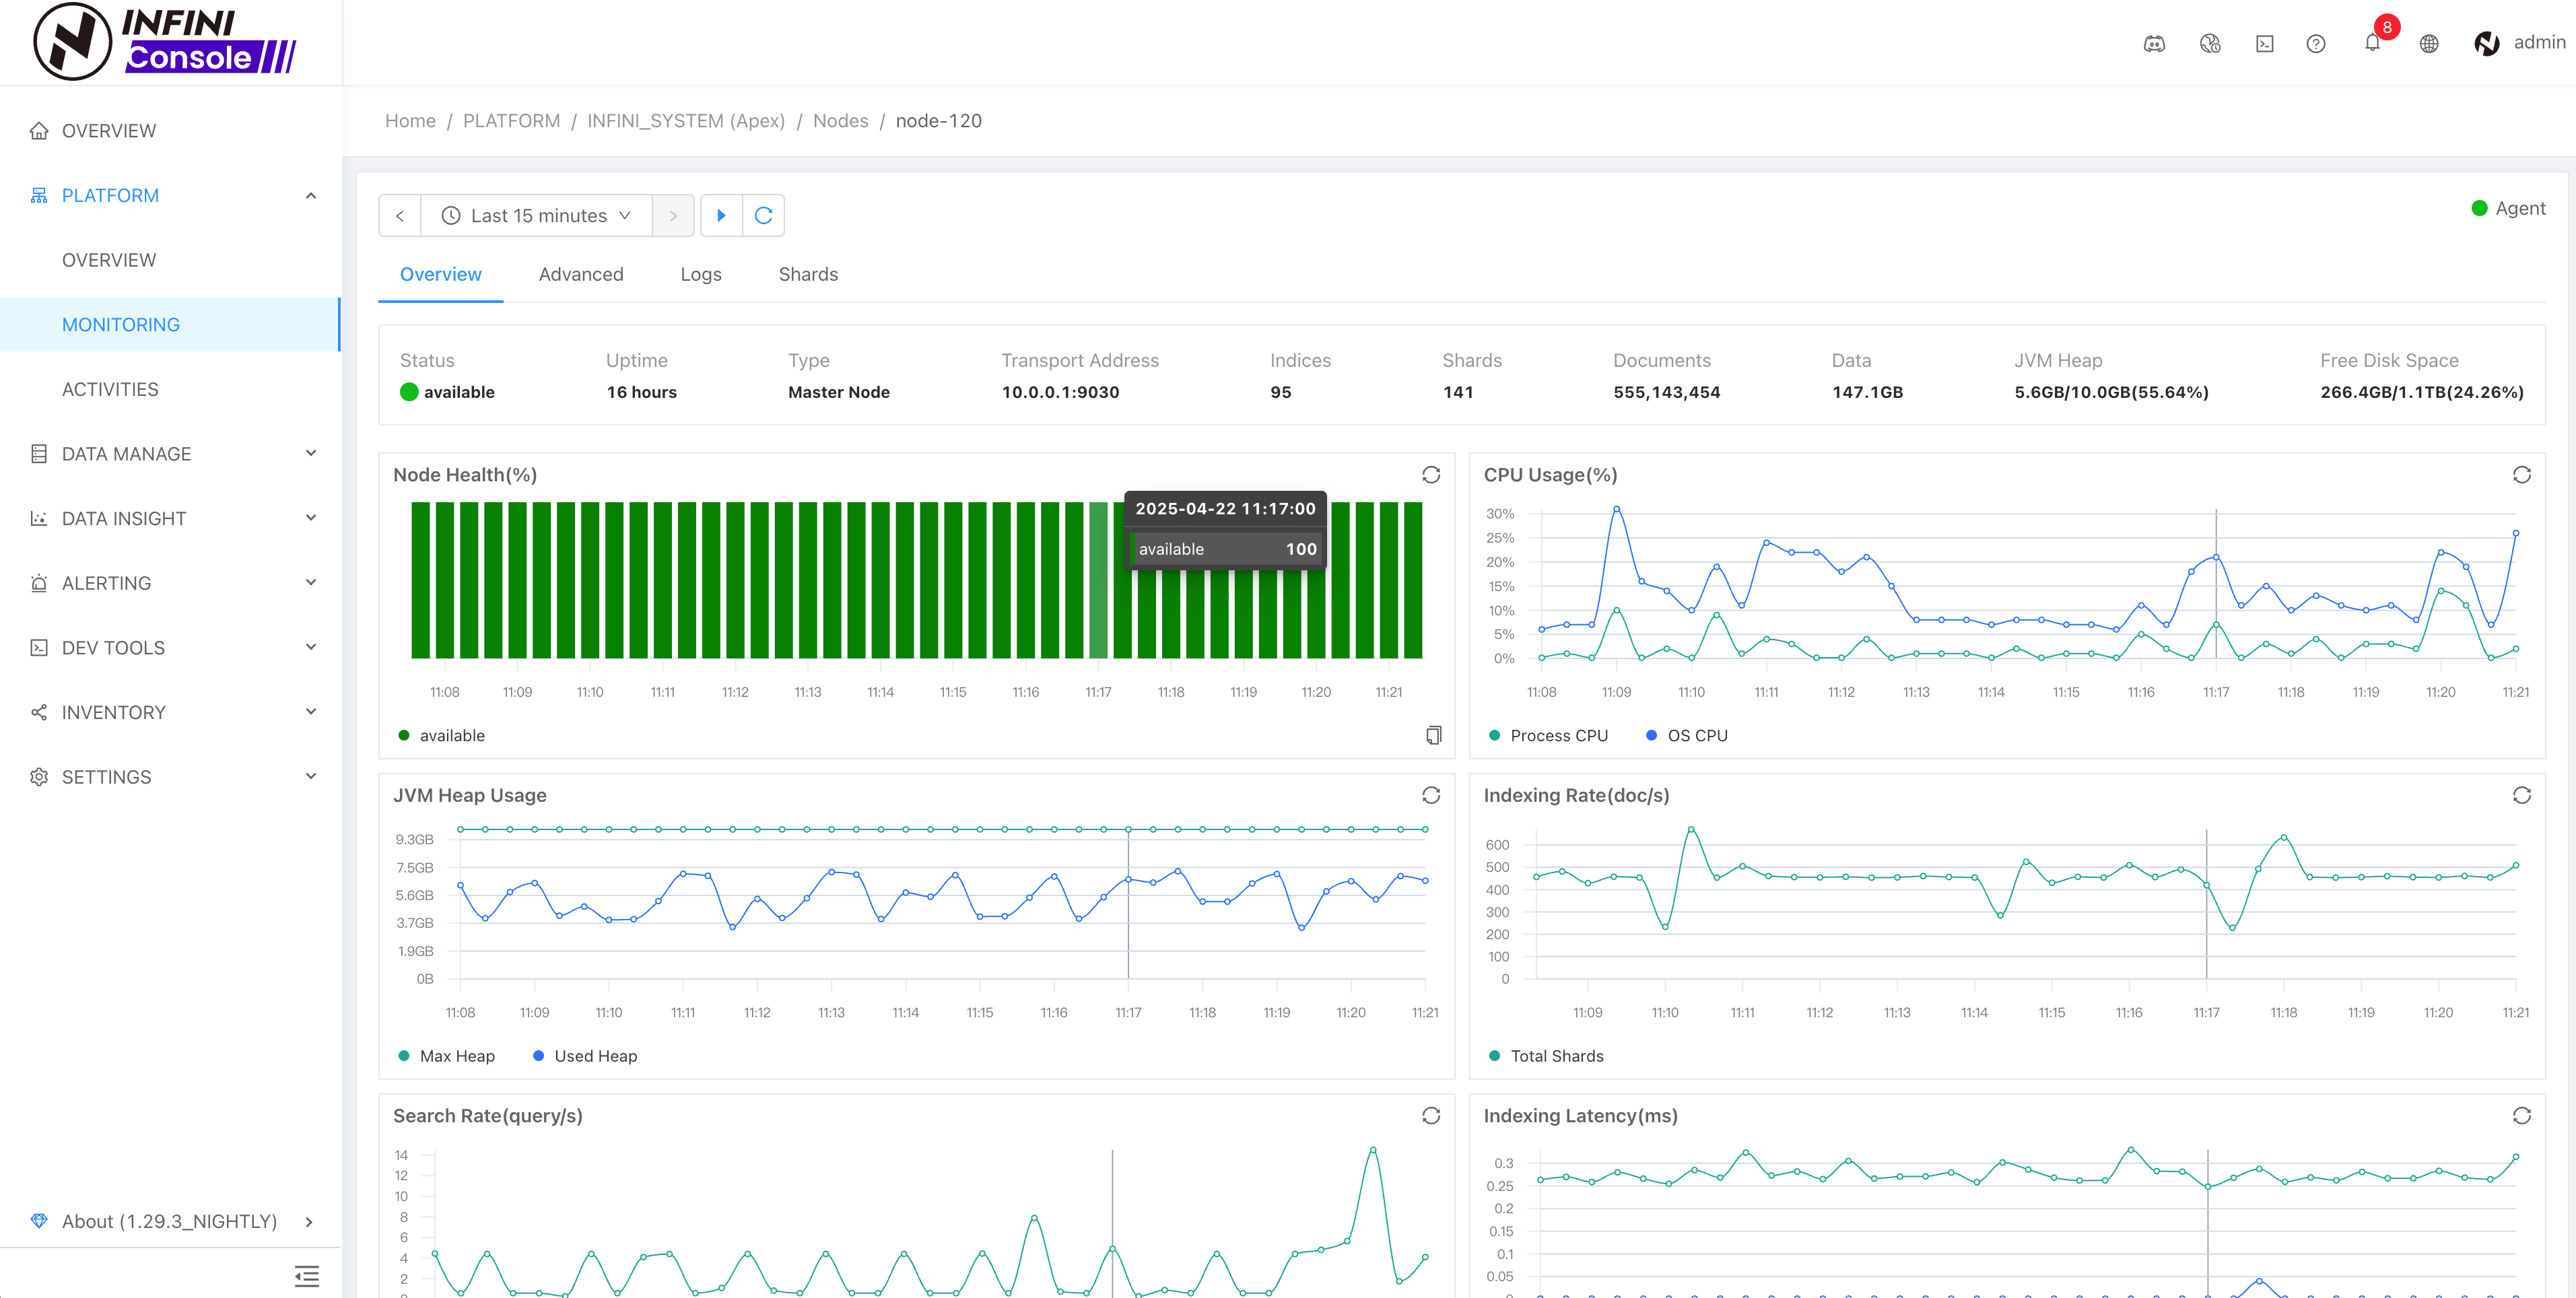
Here you can view the metrics monitoring information and related fragmentation information of a single node.
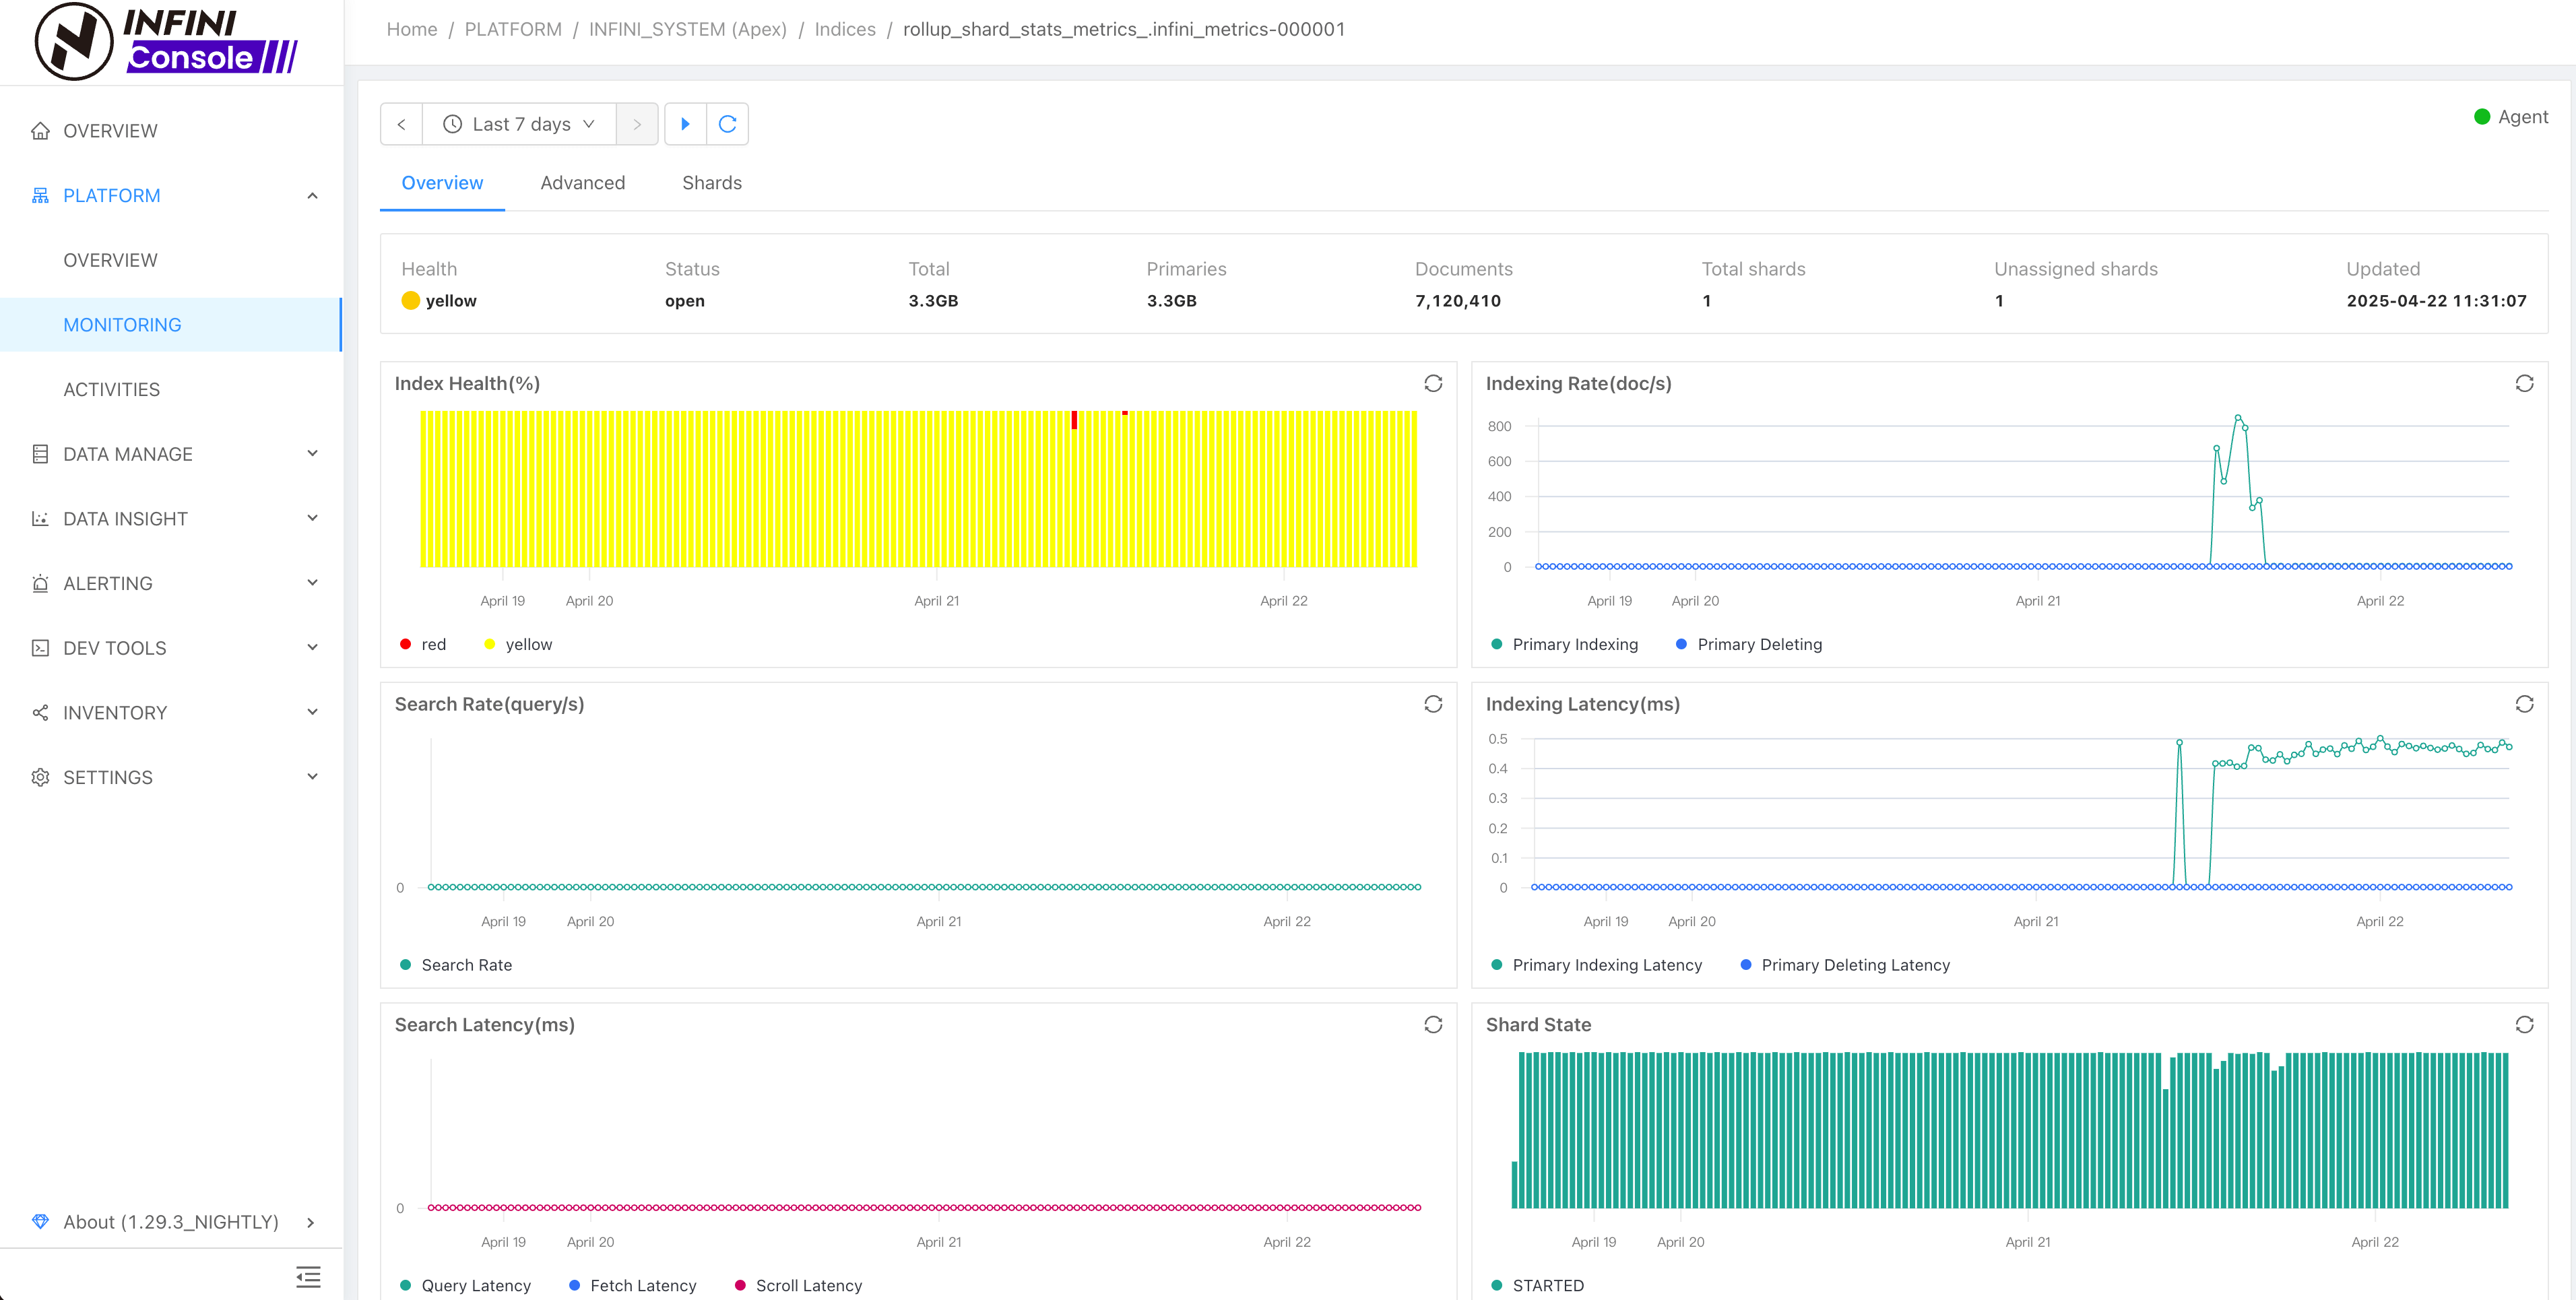
View Index Metrics #
Click the Indexes tab to see a list of cluster indexes.
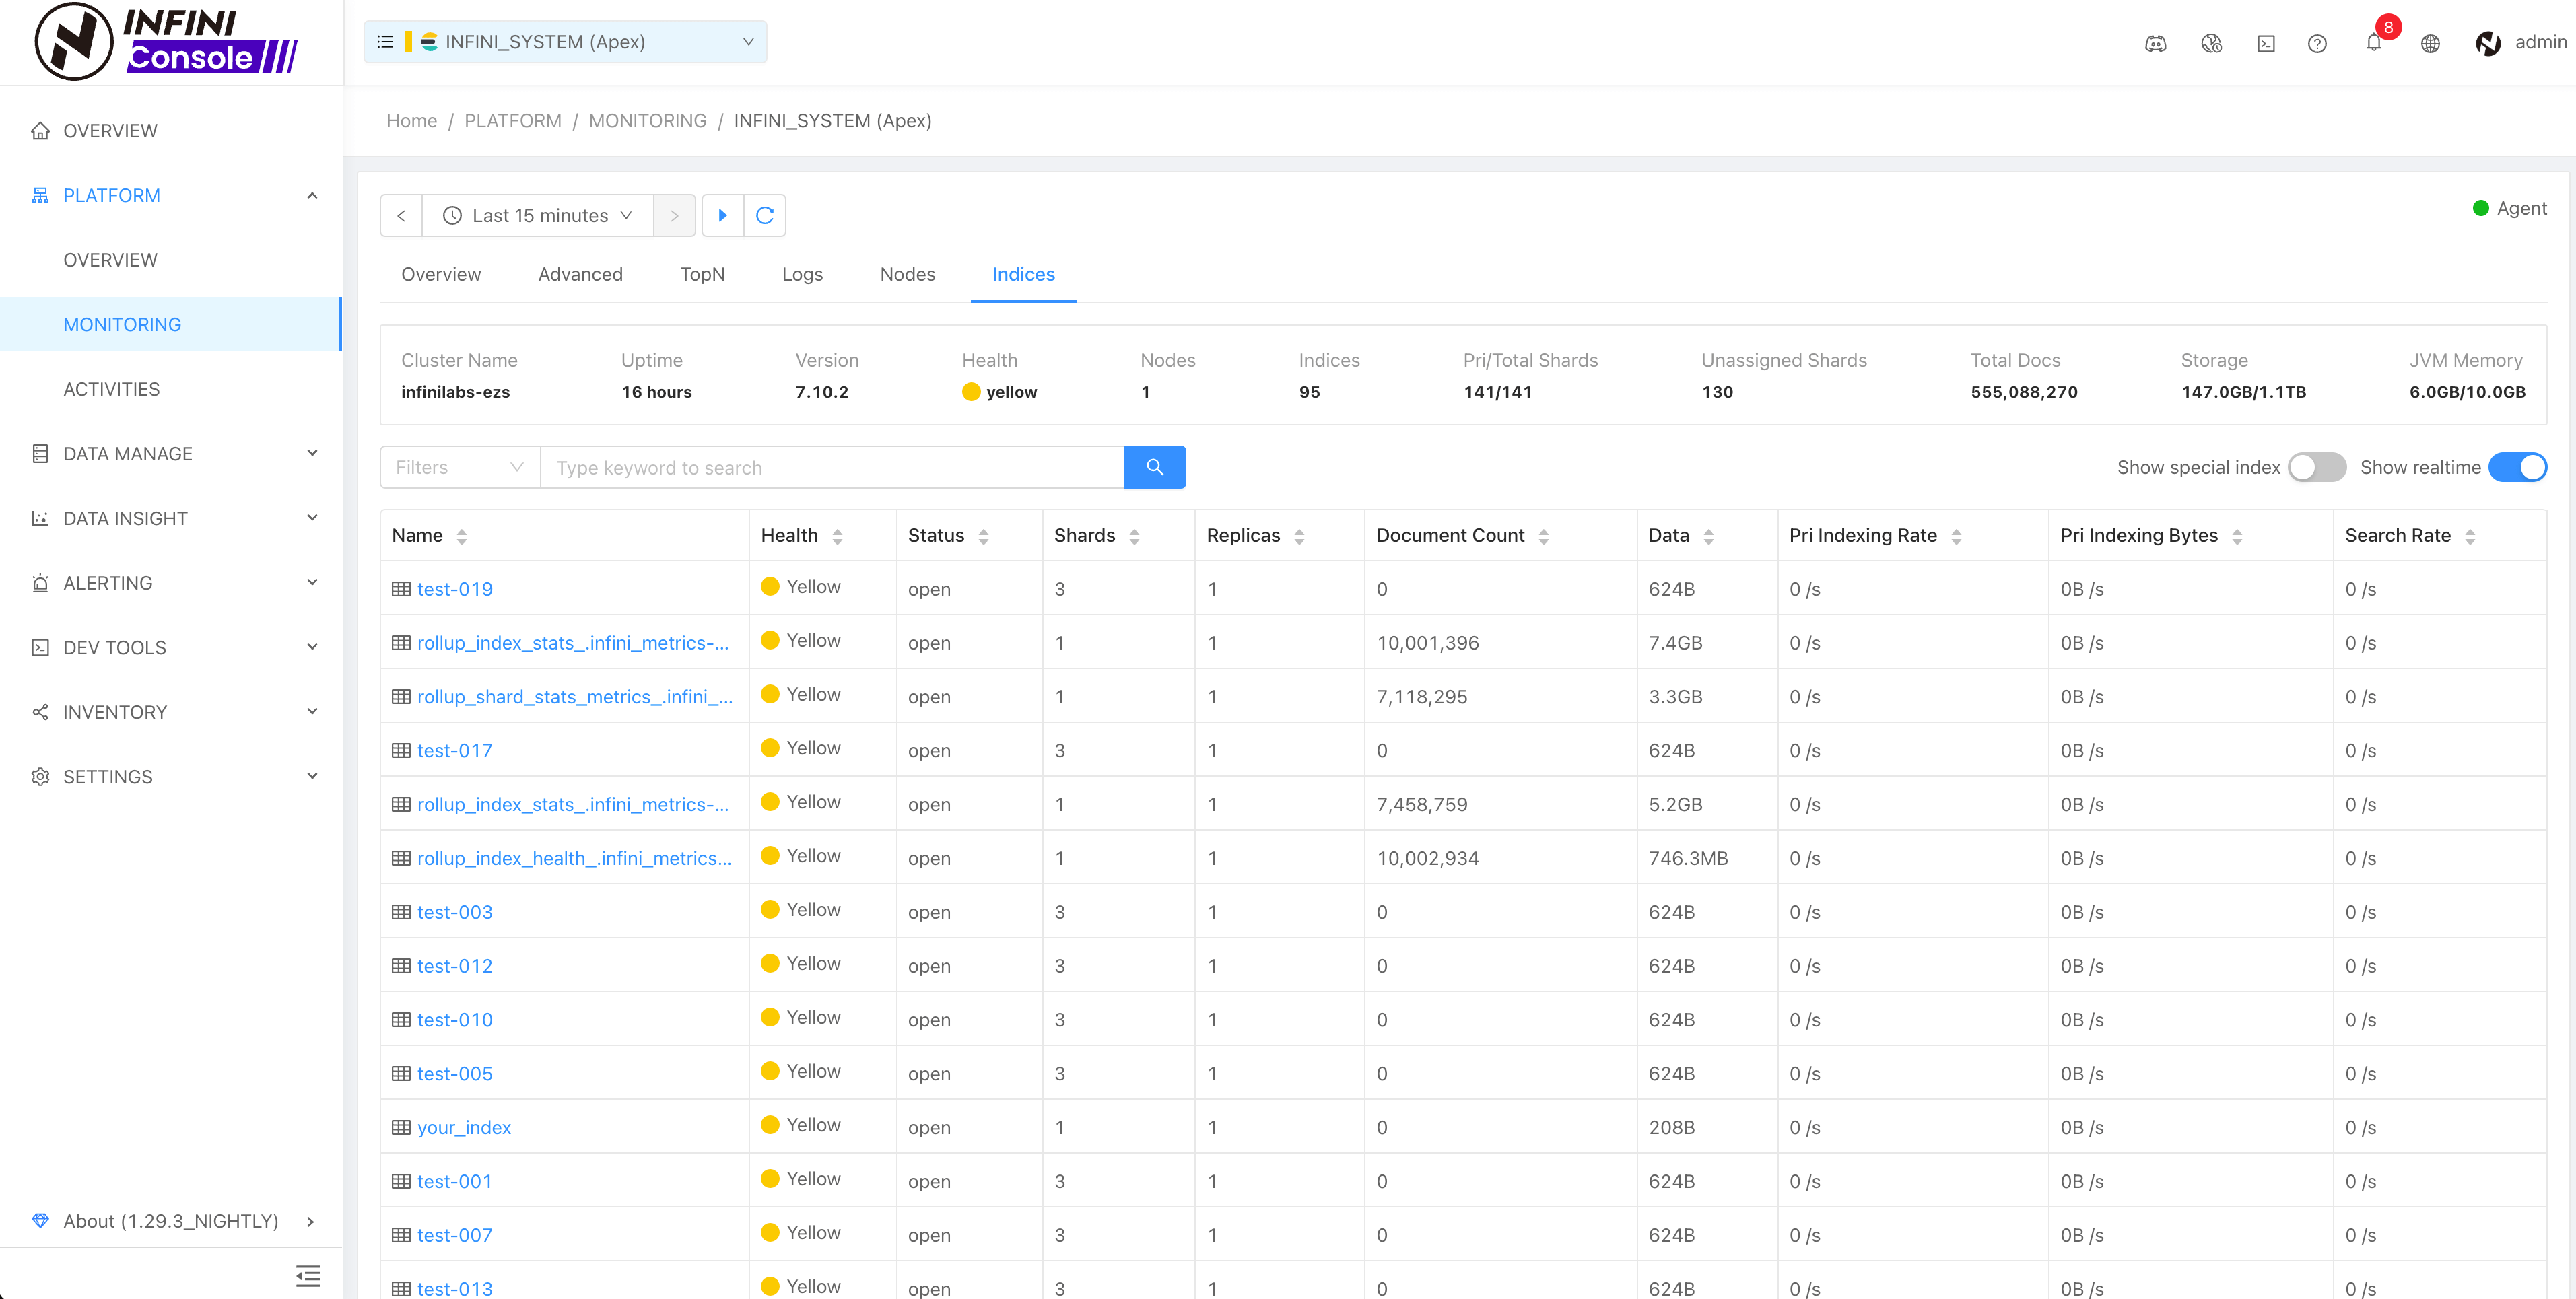
Click the index name in the list to view the monitoring of the specified index