Agent Metric Collect Mode Configuration #
Introduction #
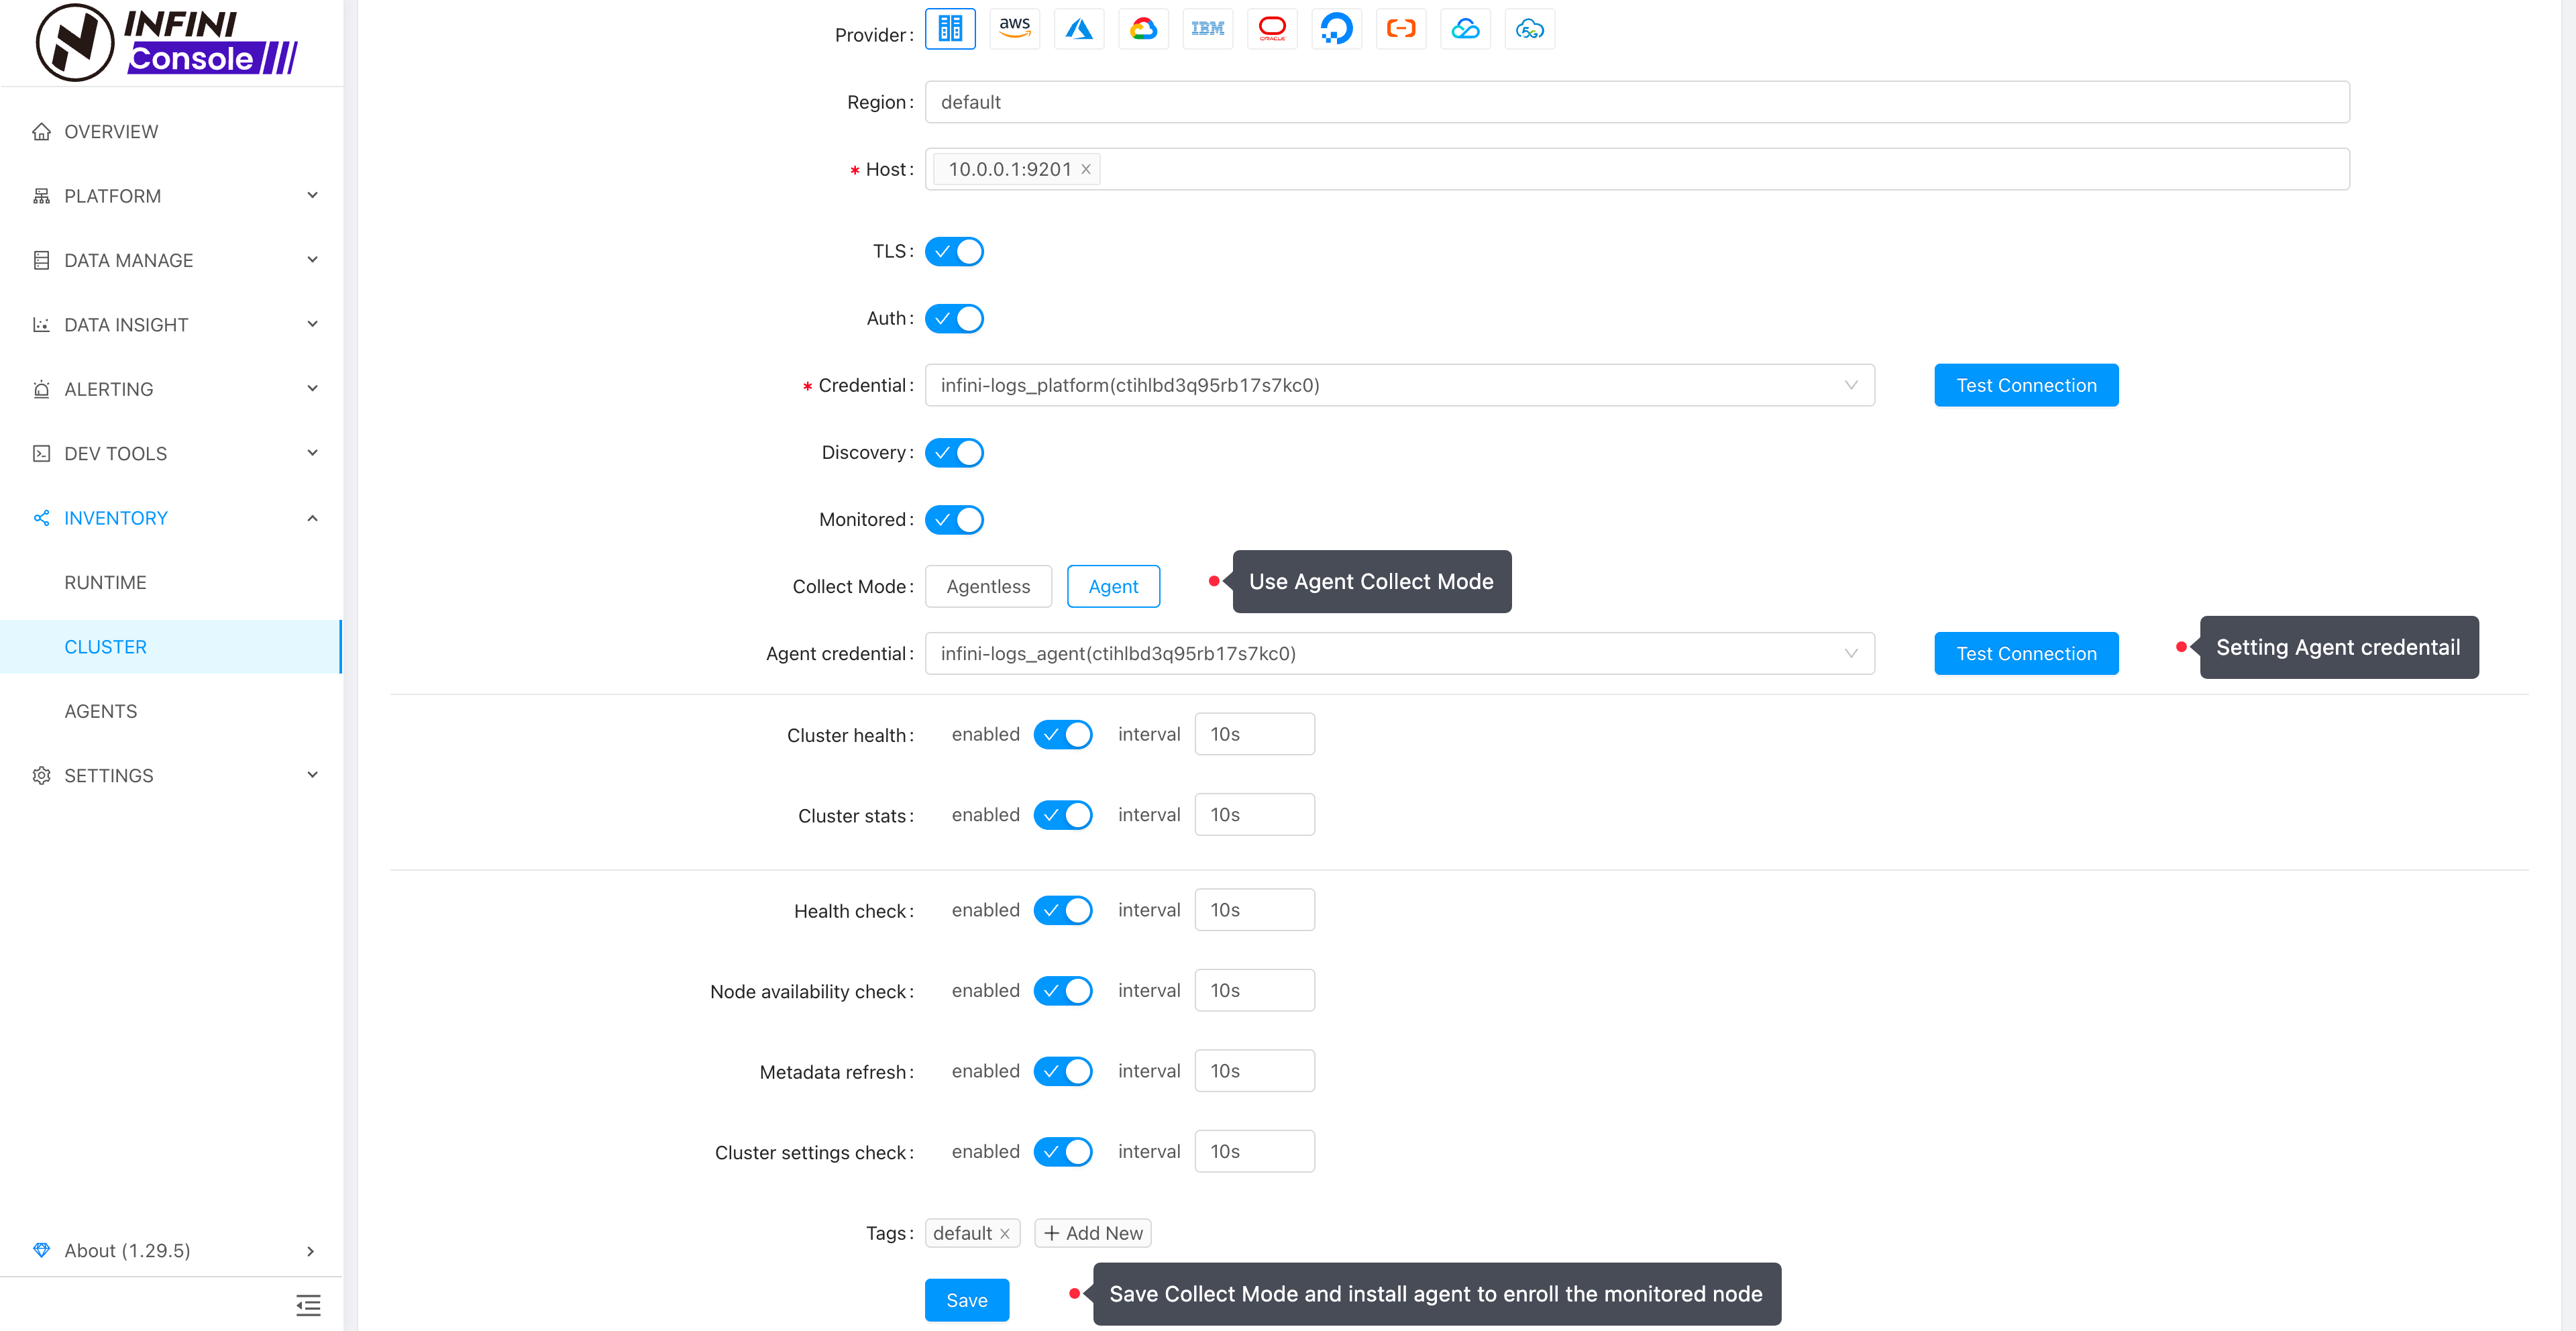
By default, when a new cluster is registered with the Console, the monitoring feature is enabled, which automatically collects metric data for the cluster. If the monitored cluster has a large number of nodes (e.g., 10 or more), or if the volume of metric data from the cluster is substantial, performance can be optimized by switching to the Agent collection mode. Switching to Agent Metric Collection Monitoring Mode
Configuring Agent Association with Cluster Nodes #
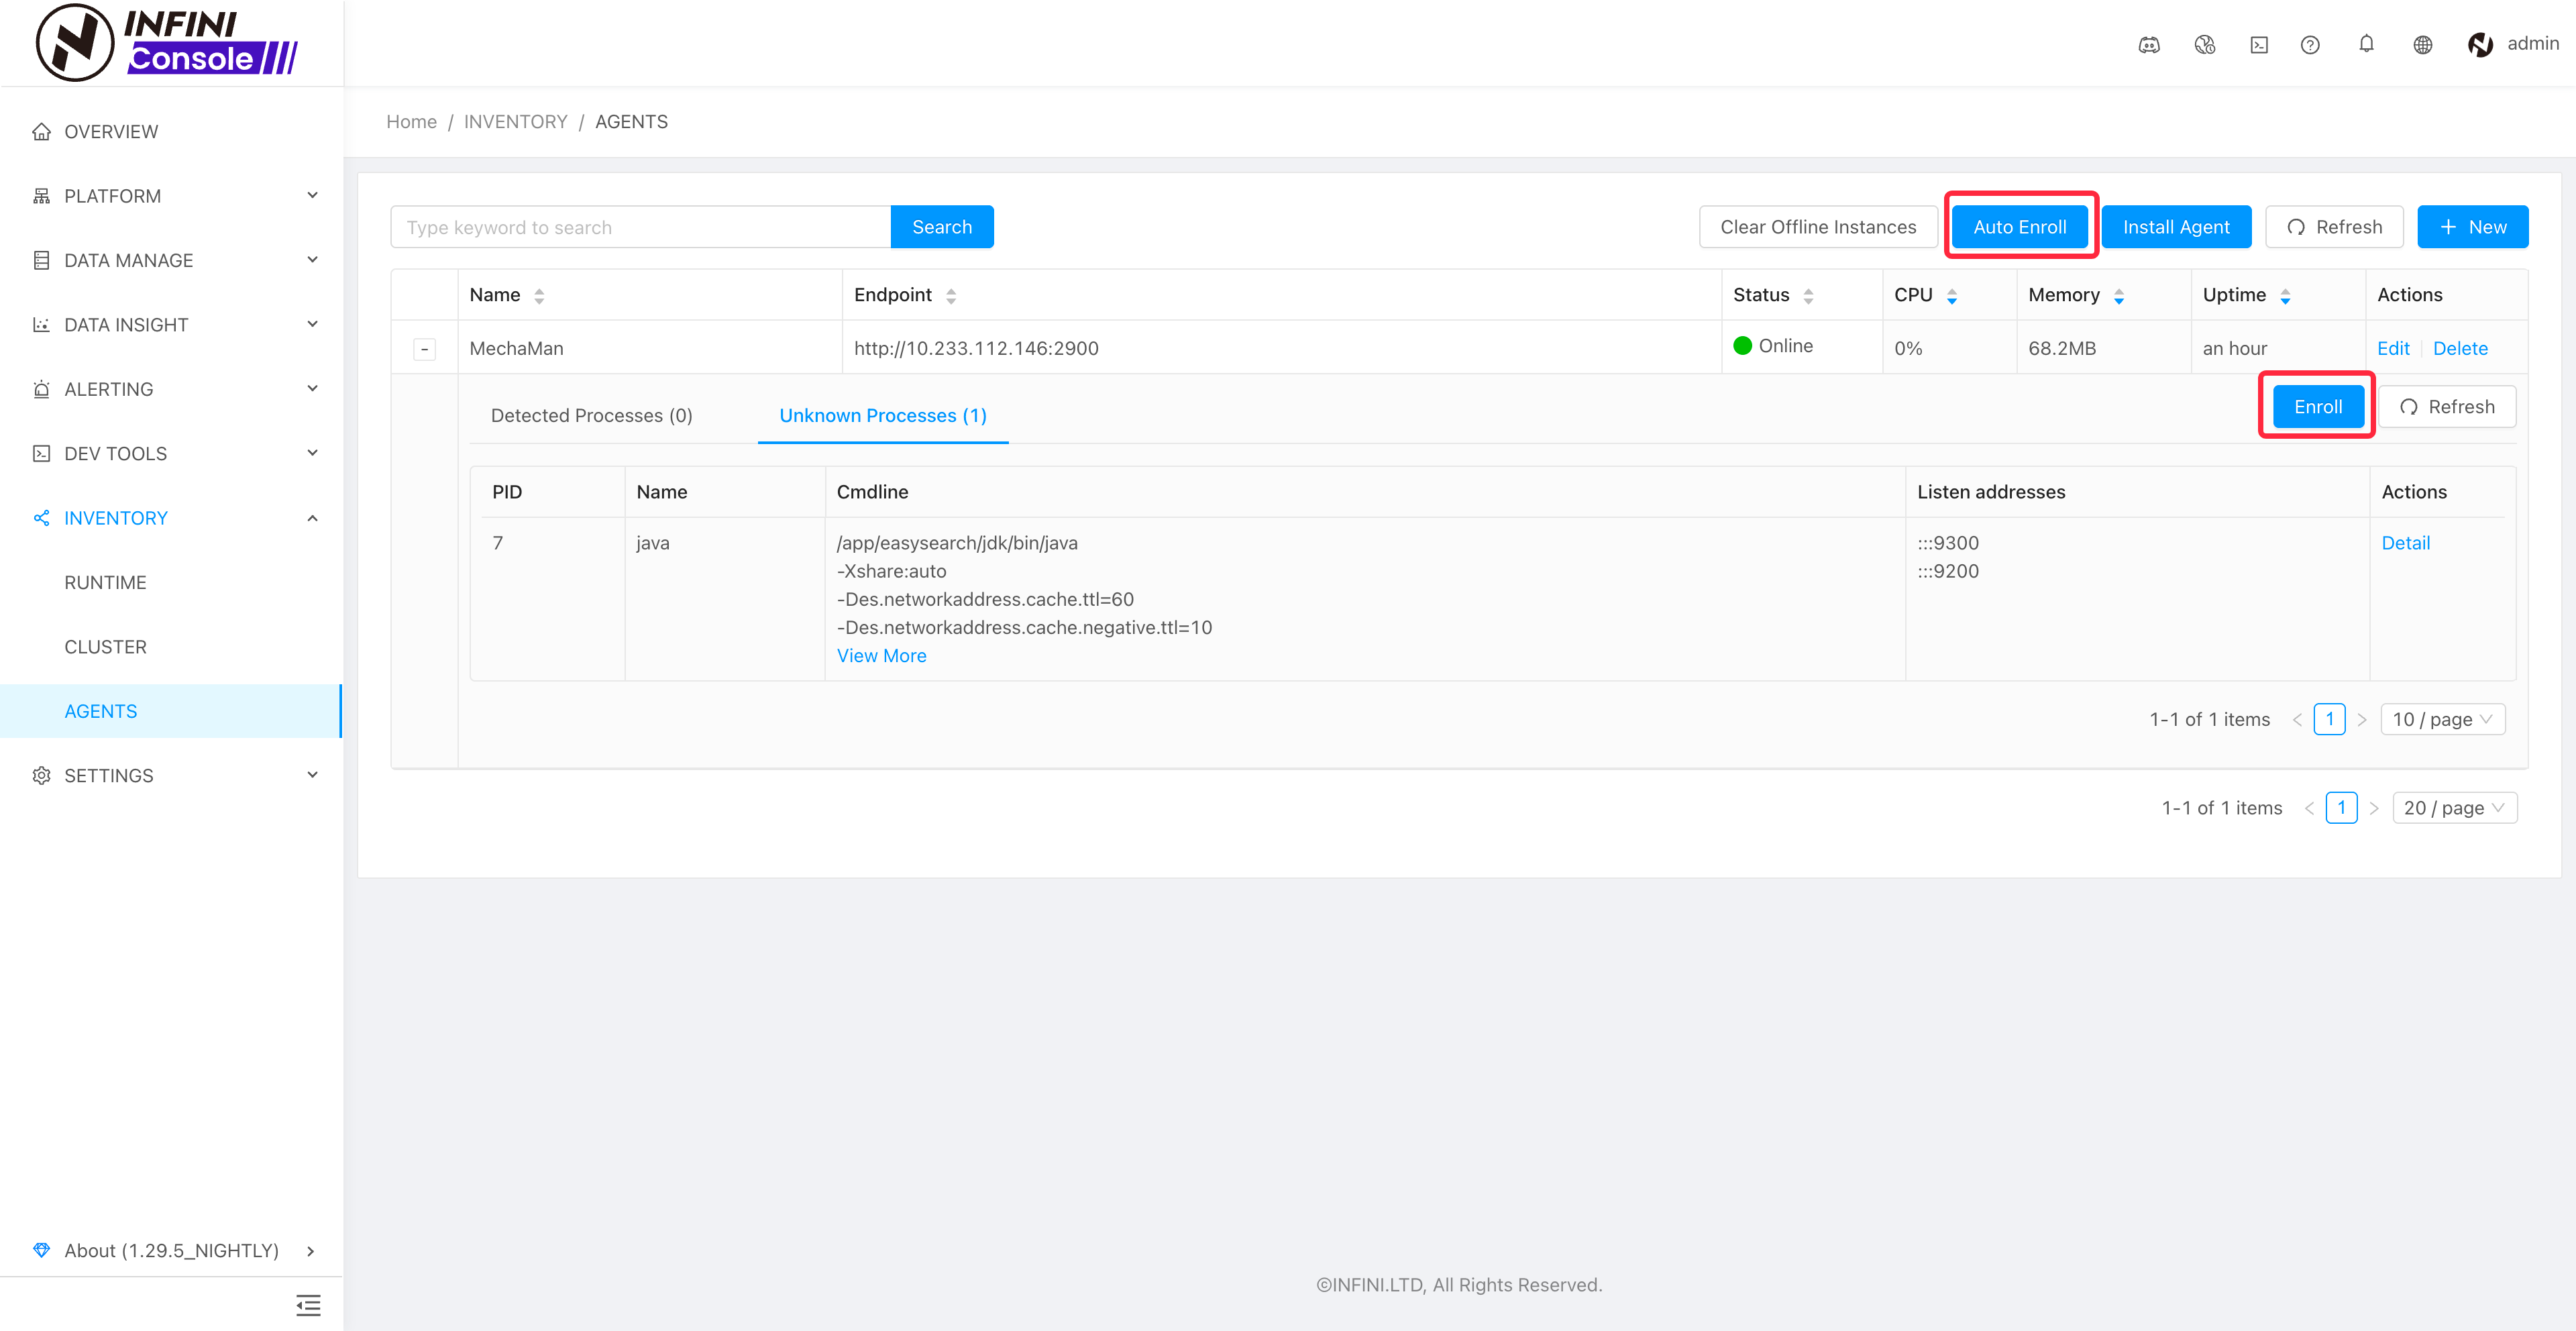
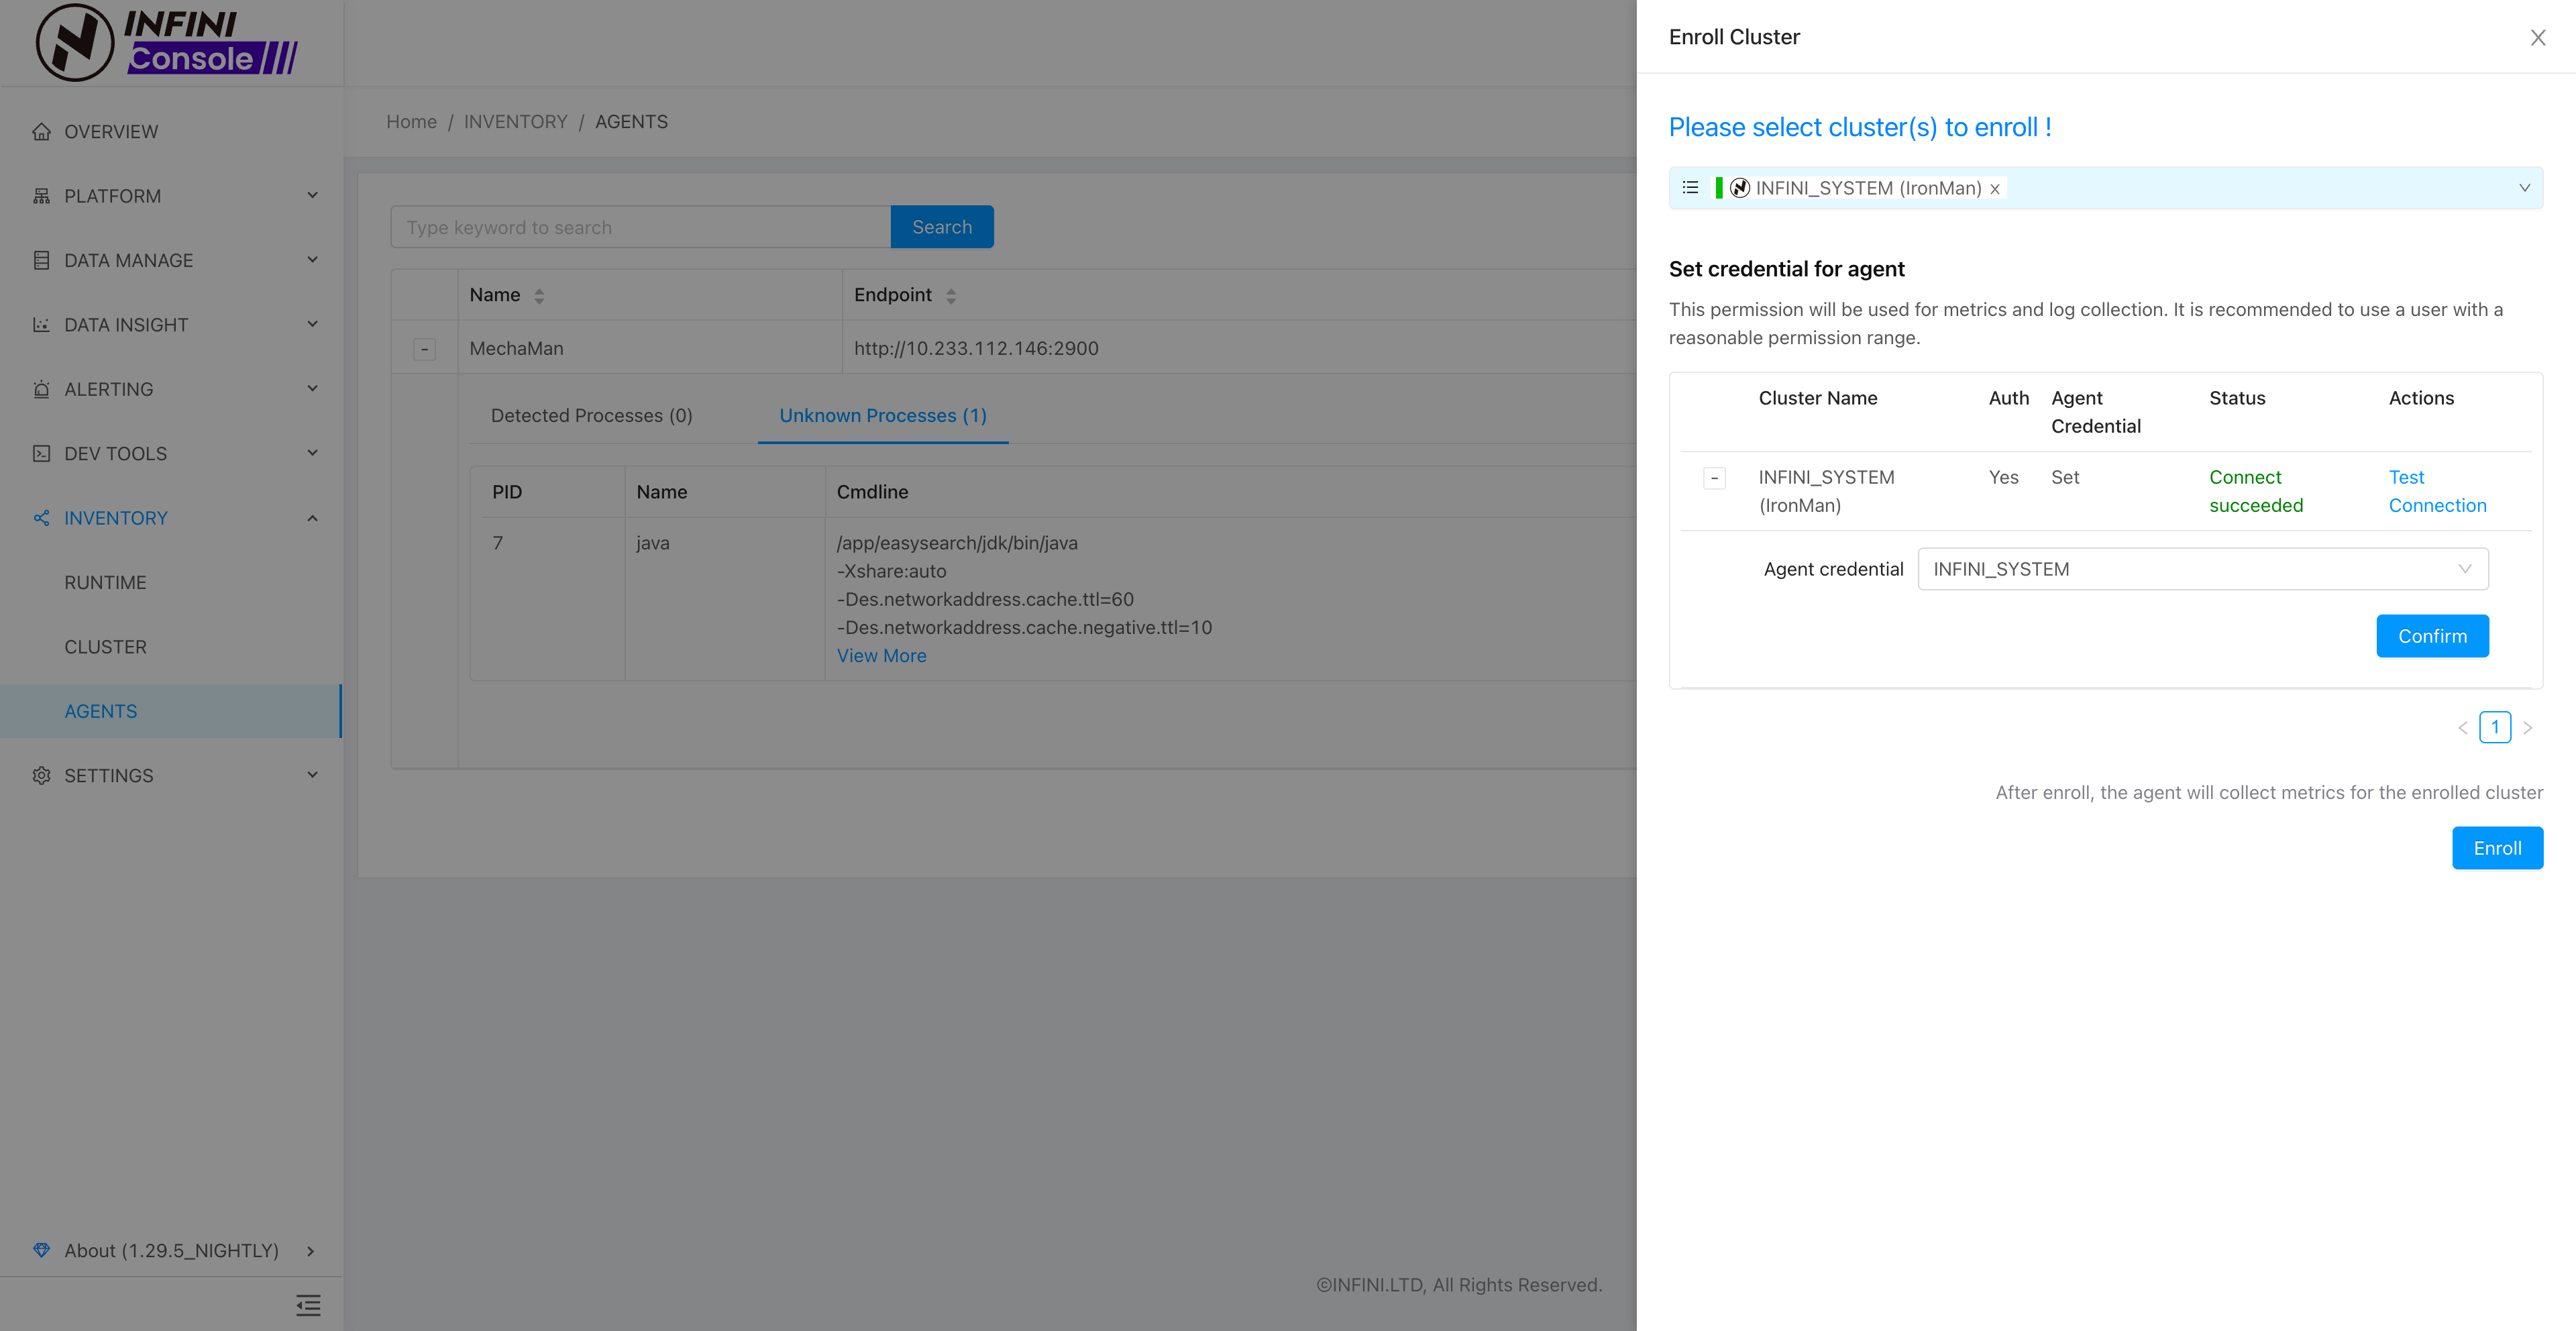
Typically, after an Agent is installed, it automatically registers with the Console and discovers Easysearch, Elasticsearch, or OpenSearch processes running on its host node. By default, it collects node-level metrics such as CPU, memory, and disk usage. However, manual association is required to collect shard-level metrics for cluster nodes. In the Agent list, click the expand button on an Agent’s row to access the process association interface. If there are many nodes to associate, you can click “Auto Associate” to perform the operation.
Verifying Agent Metric Collection #
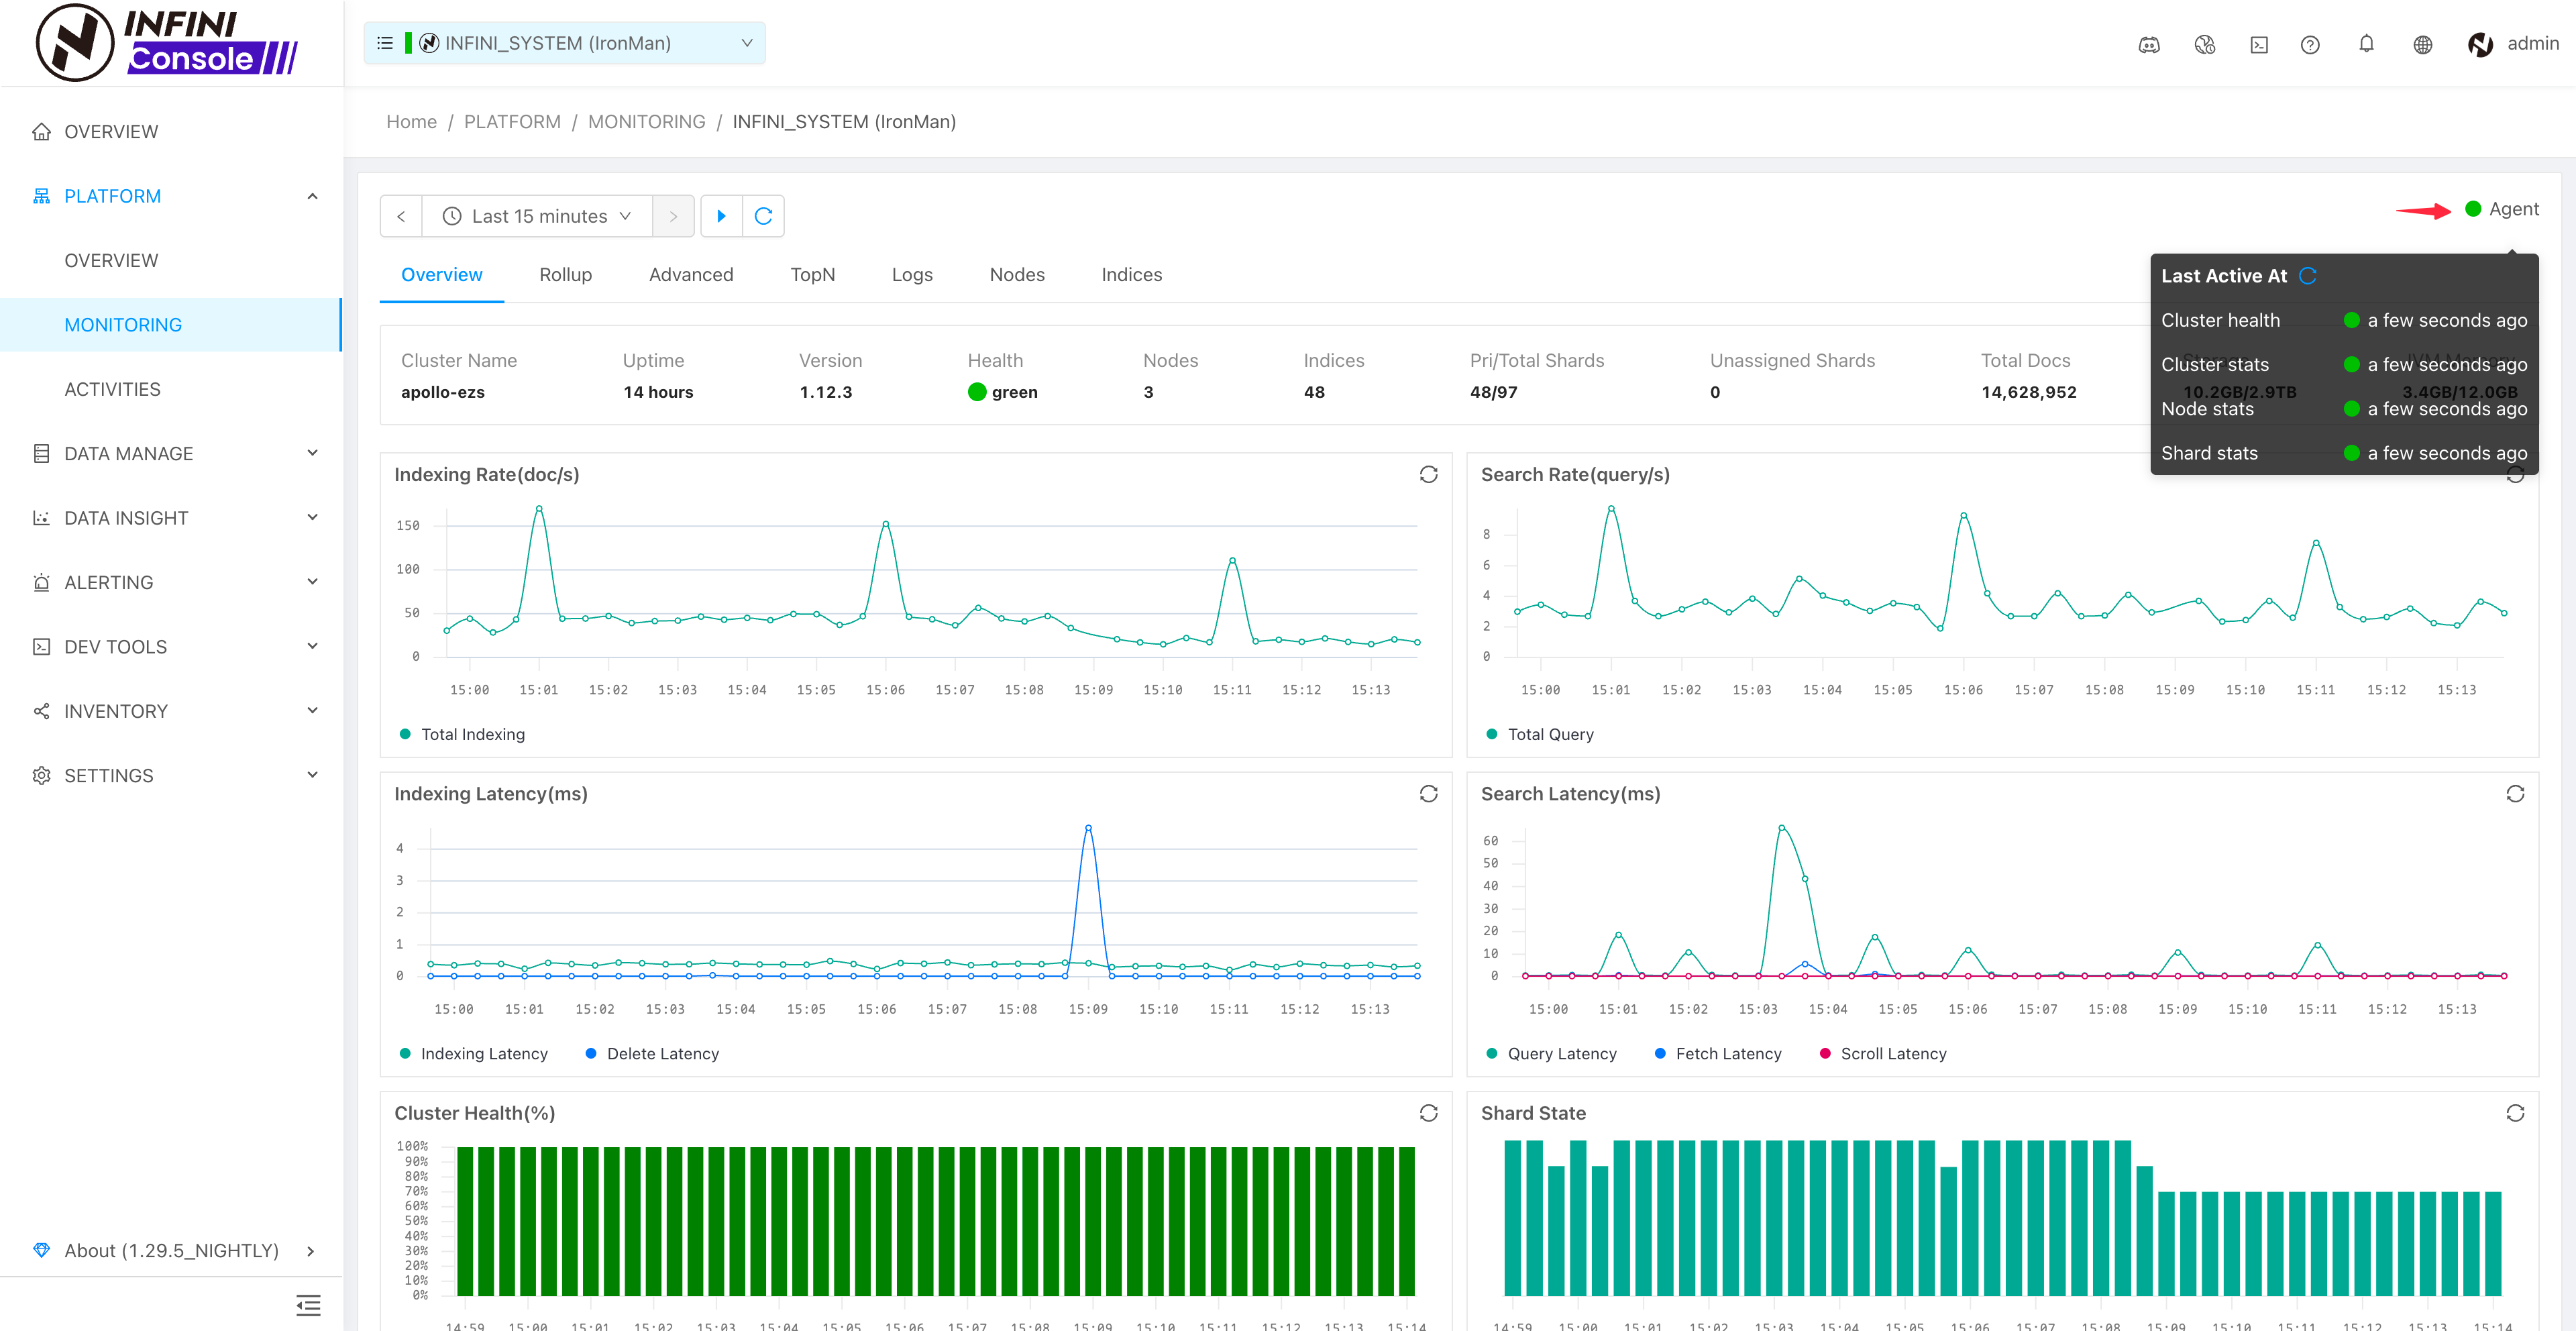
On the Monitoring page, you can view the Agent collection status and the data latency for various metrics in the top-right corner.
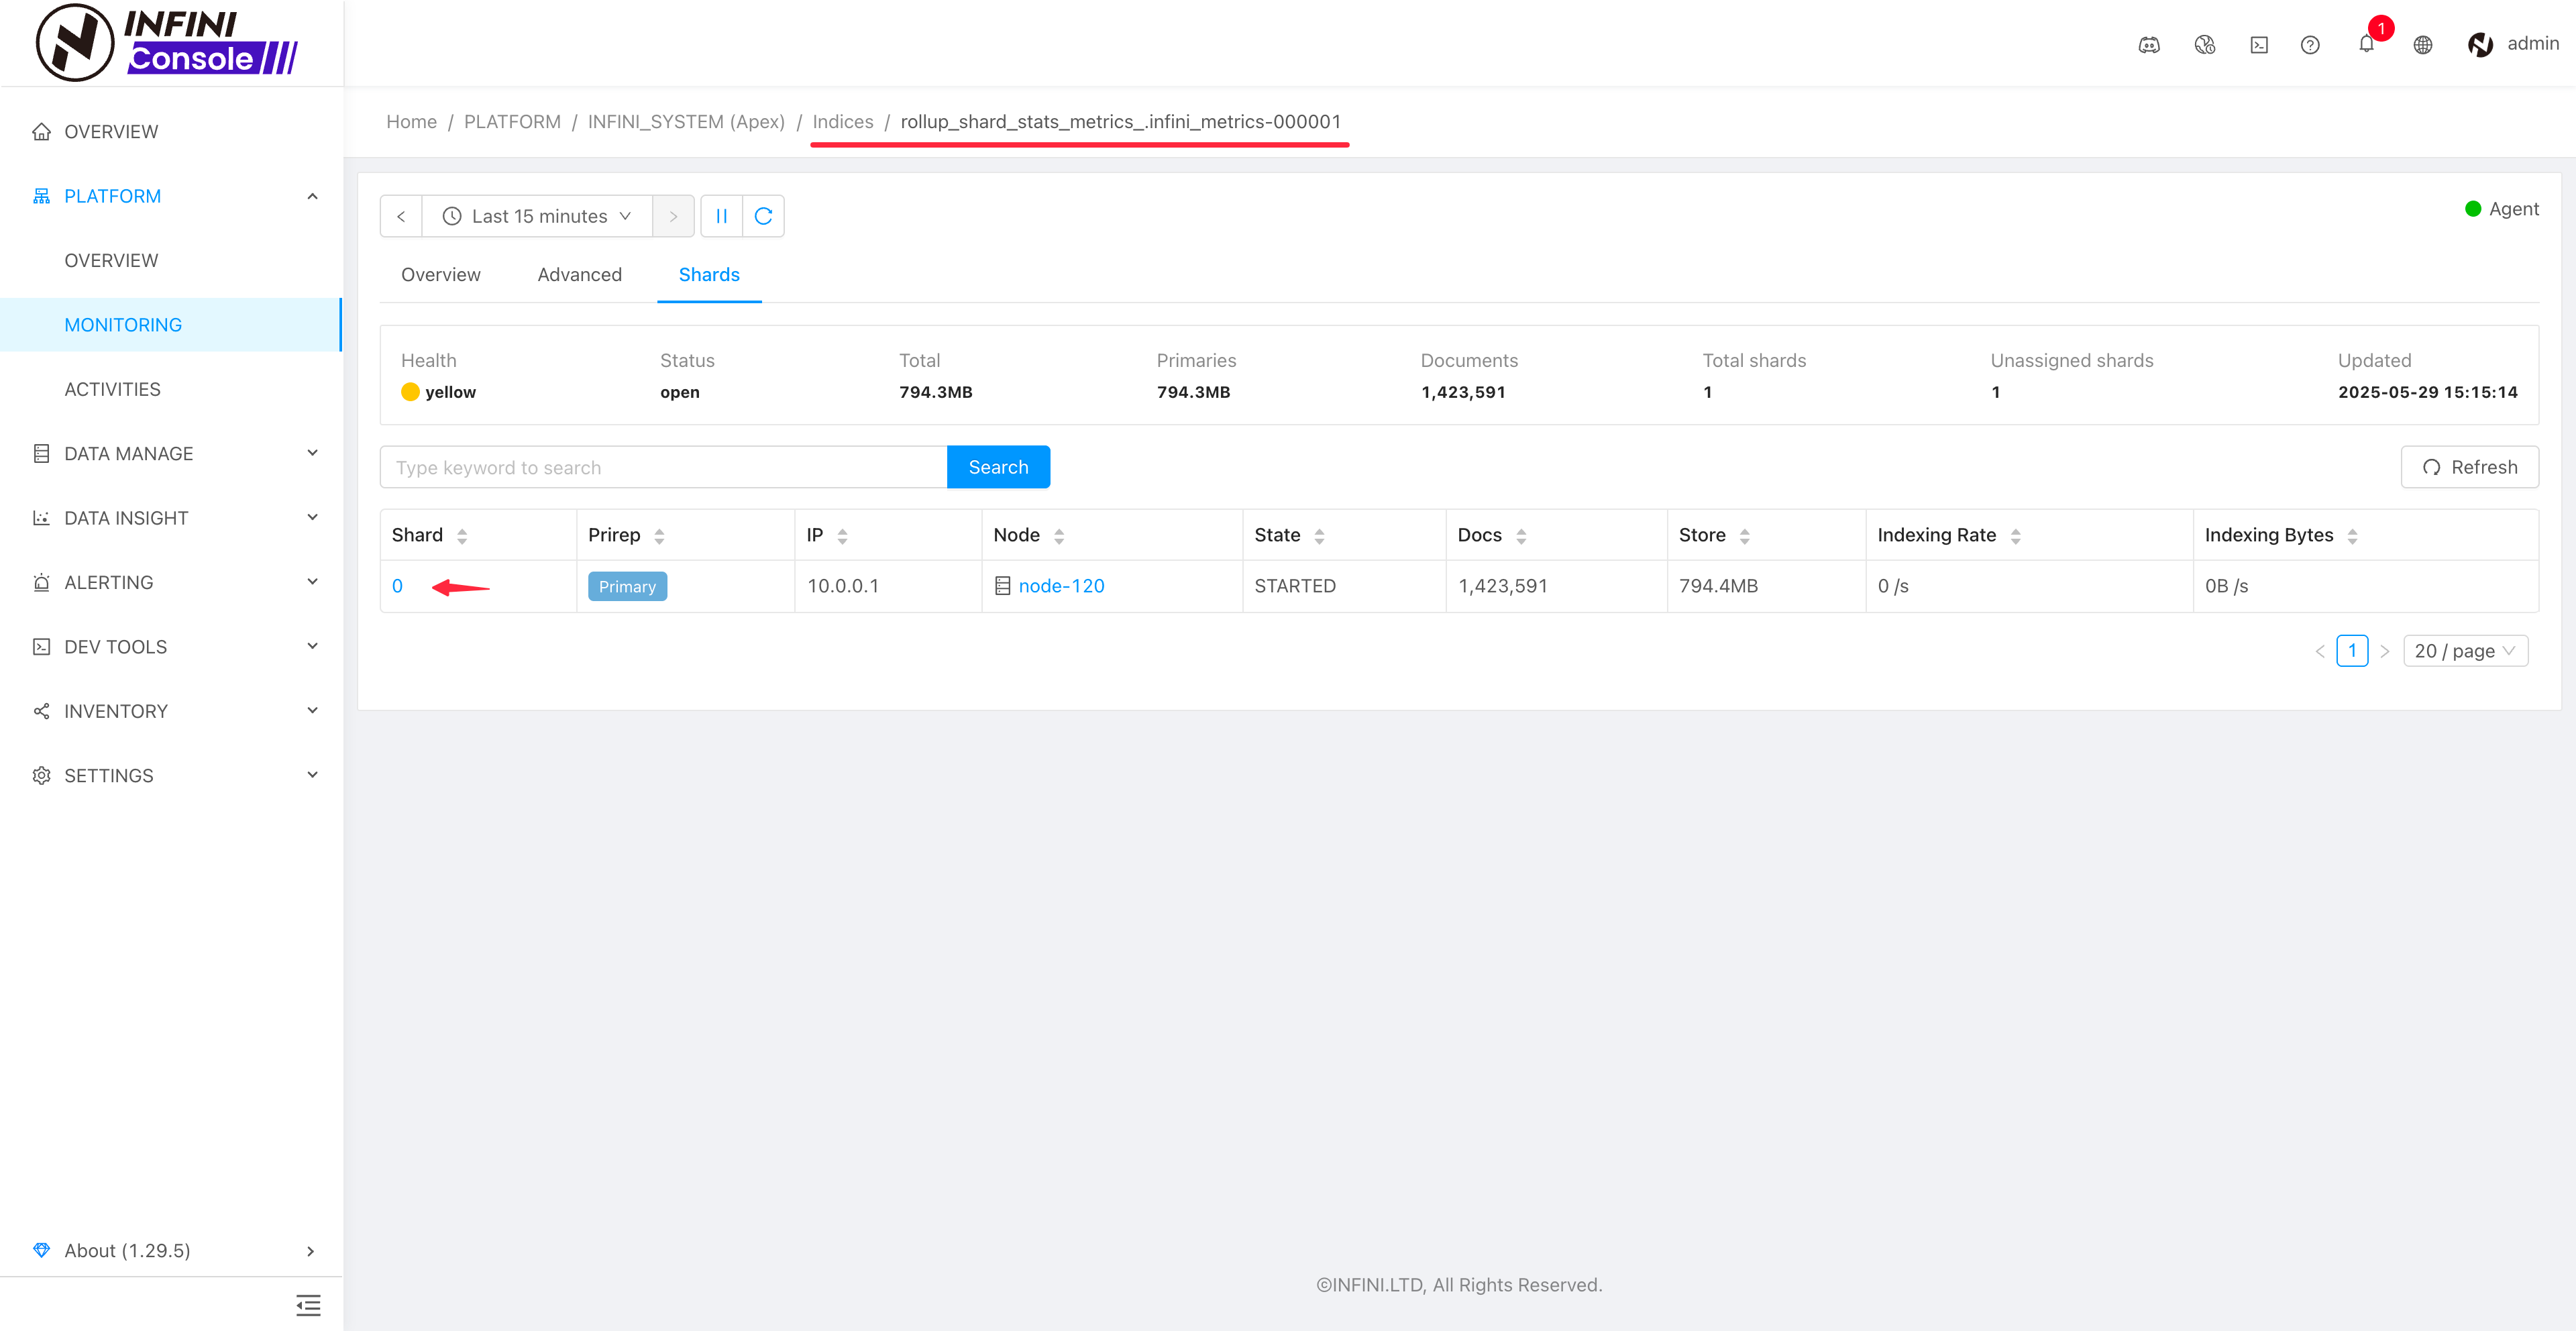
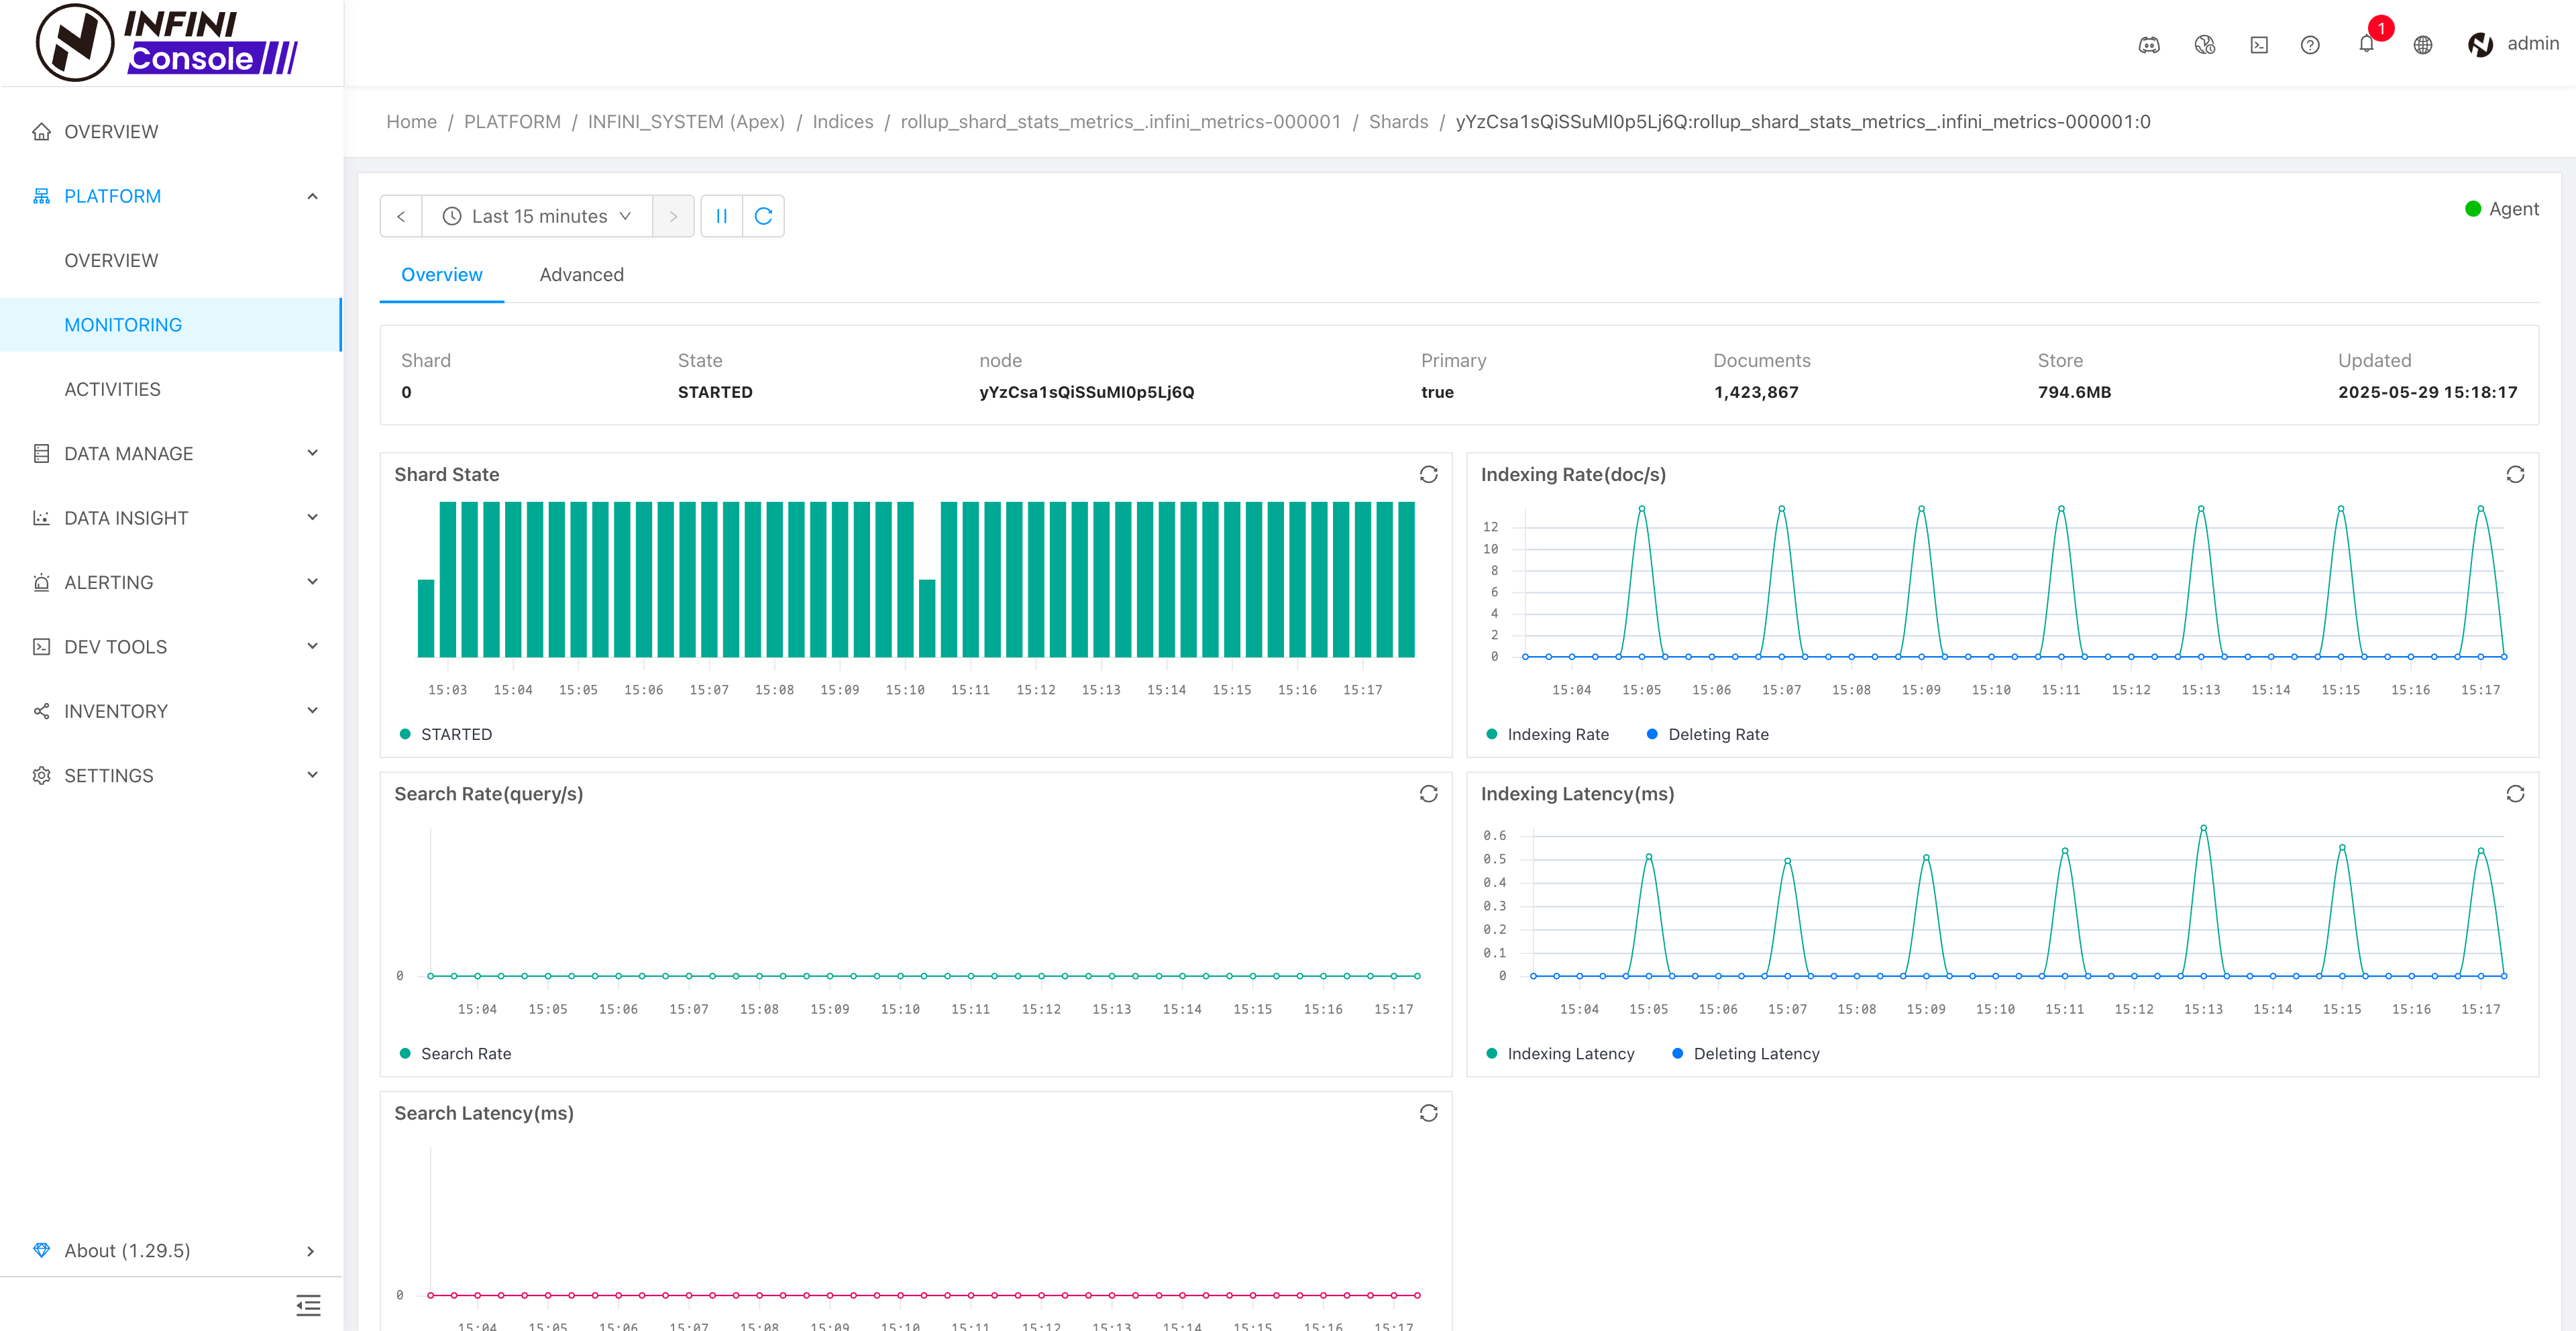
On the Index Monitoring page, you will notice that shard numbers are clickable, allowing you to view detailed monitoring metrics for each shard. #