Getting Started with the TopN Metrics Feature in INFINI Console #
Background #
In distributed search engine systems (such as Easysearch, Elasticsearch, and OpenSearch), performance monitoring is crucial. To ensure efficient system operation and reasonable resource allocation, it is important to observe the usage of key resources—especially memory and CPU usage of indices, nodes, and shards—over a period of time.
By performing TopN queries on these key metrics, we can identify the nodes, indices, or shards that consume the most resources, helping us quickly locate potential performance bottlenecks or overloaded components. This real-time monitoring not only improves overall cluster resource allocation but also enables timely adjustments when performance issues arise, minimizing service impact.
What is Console’s TopN? #
TopN is a major new feature introduced in Console v1.28.0, designed to quickly identify the top N key metric data points. With powerful multidimensional metric analysis capabilities, it helps users optimize performance and make informed decisions more efficiently.
As the number of cluster nodes and indices continues to grow, traditional monitoring methods have struggled to meet the need for efficient problem localization. Previously, Console’s monitoring tools focused more on multi-dimensional metrics for a single node or index. However, when users needed to quickly find the busiest, slowest, or largest key data points across all nodes or indices, it often proved inconvenient.
Although Console provides powerful advanced analytics, navigating a large number of metrics could result in slower loading speeds and overly dense data, making it difficult to identify issues at a glance. TopN was introduced to address these pain points by offering more precise and efficient monitoring and analytical capabilities.
The TopN metrics feature provided by INFINI Console enables users to gain a comprehensive view of cluster performance based on key indicators such as memory usage and CPU utilization. With just a few simple steps, users can quickly identify the TopN indices, nodes, or shards, and further optimize resource allocation and system performance.
Feature Overview #
Click the left-hand menu Platform Management > Monitoring Reports, and select the TopN Tab page. You will then see the following interface:
![]()
If the selected cluster uses metrics collected by INFINI Agent, you will see Nodes and Shards tabs here.
The current Agent collection mode does not yet support viewing TopN indices; this will be added in the future.
Follow these steps in order:
- Go to the Index tab
- Set the top value (default is 15)
- Select the area metric, e.g.,
Segment Memory - Select a color metric (optional), e.g.,
Index Storage - Click the search button
You will then see the top 15 indices with the highest memory usage, as shown below:
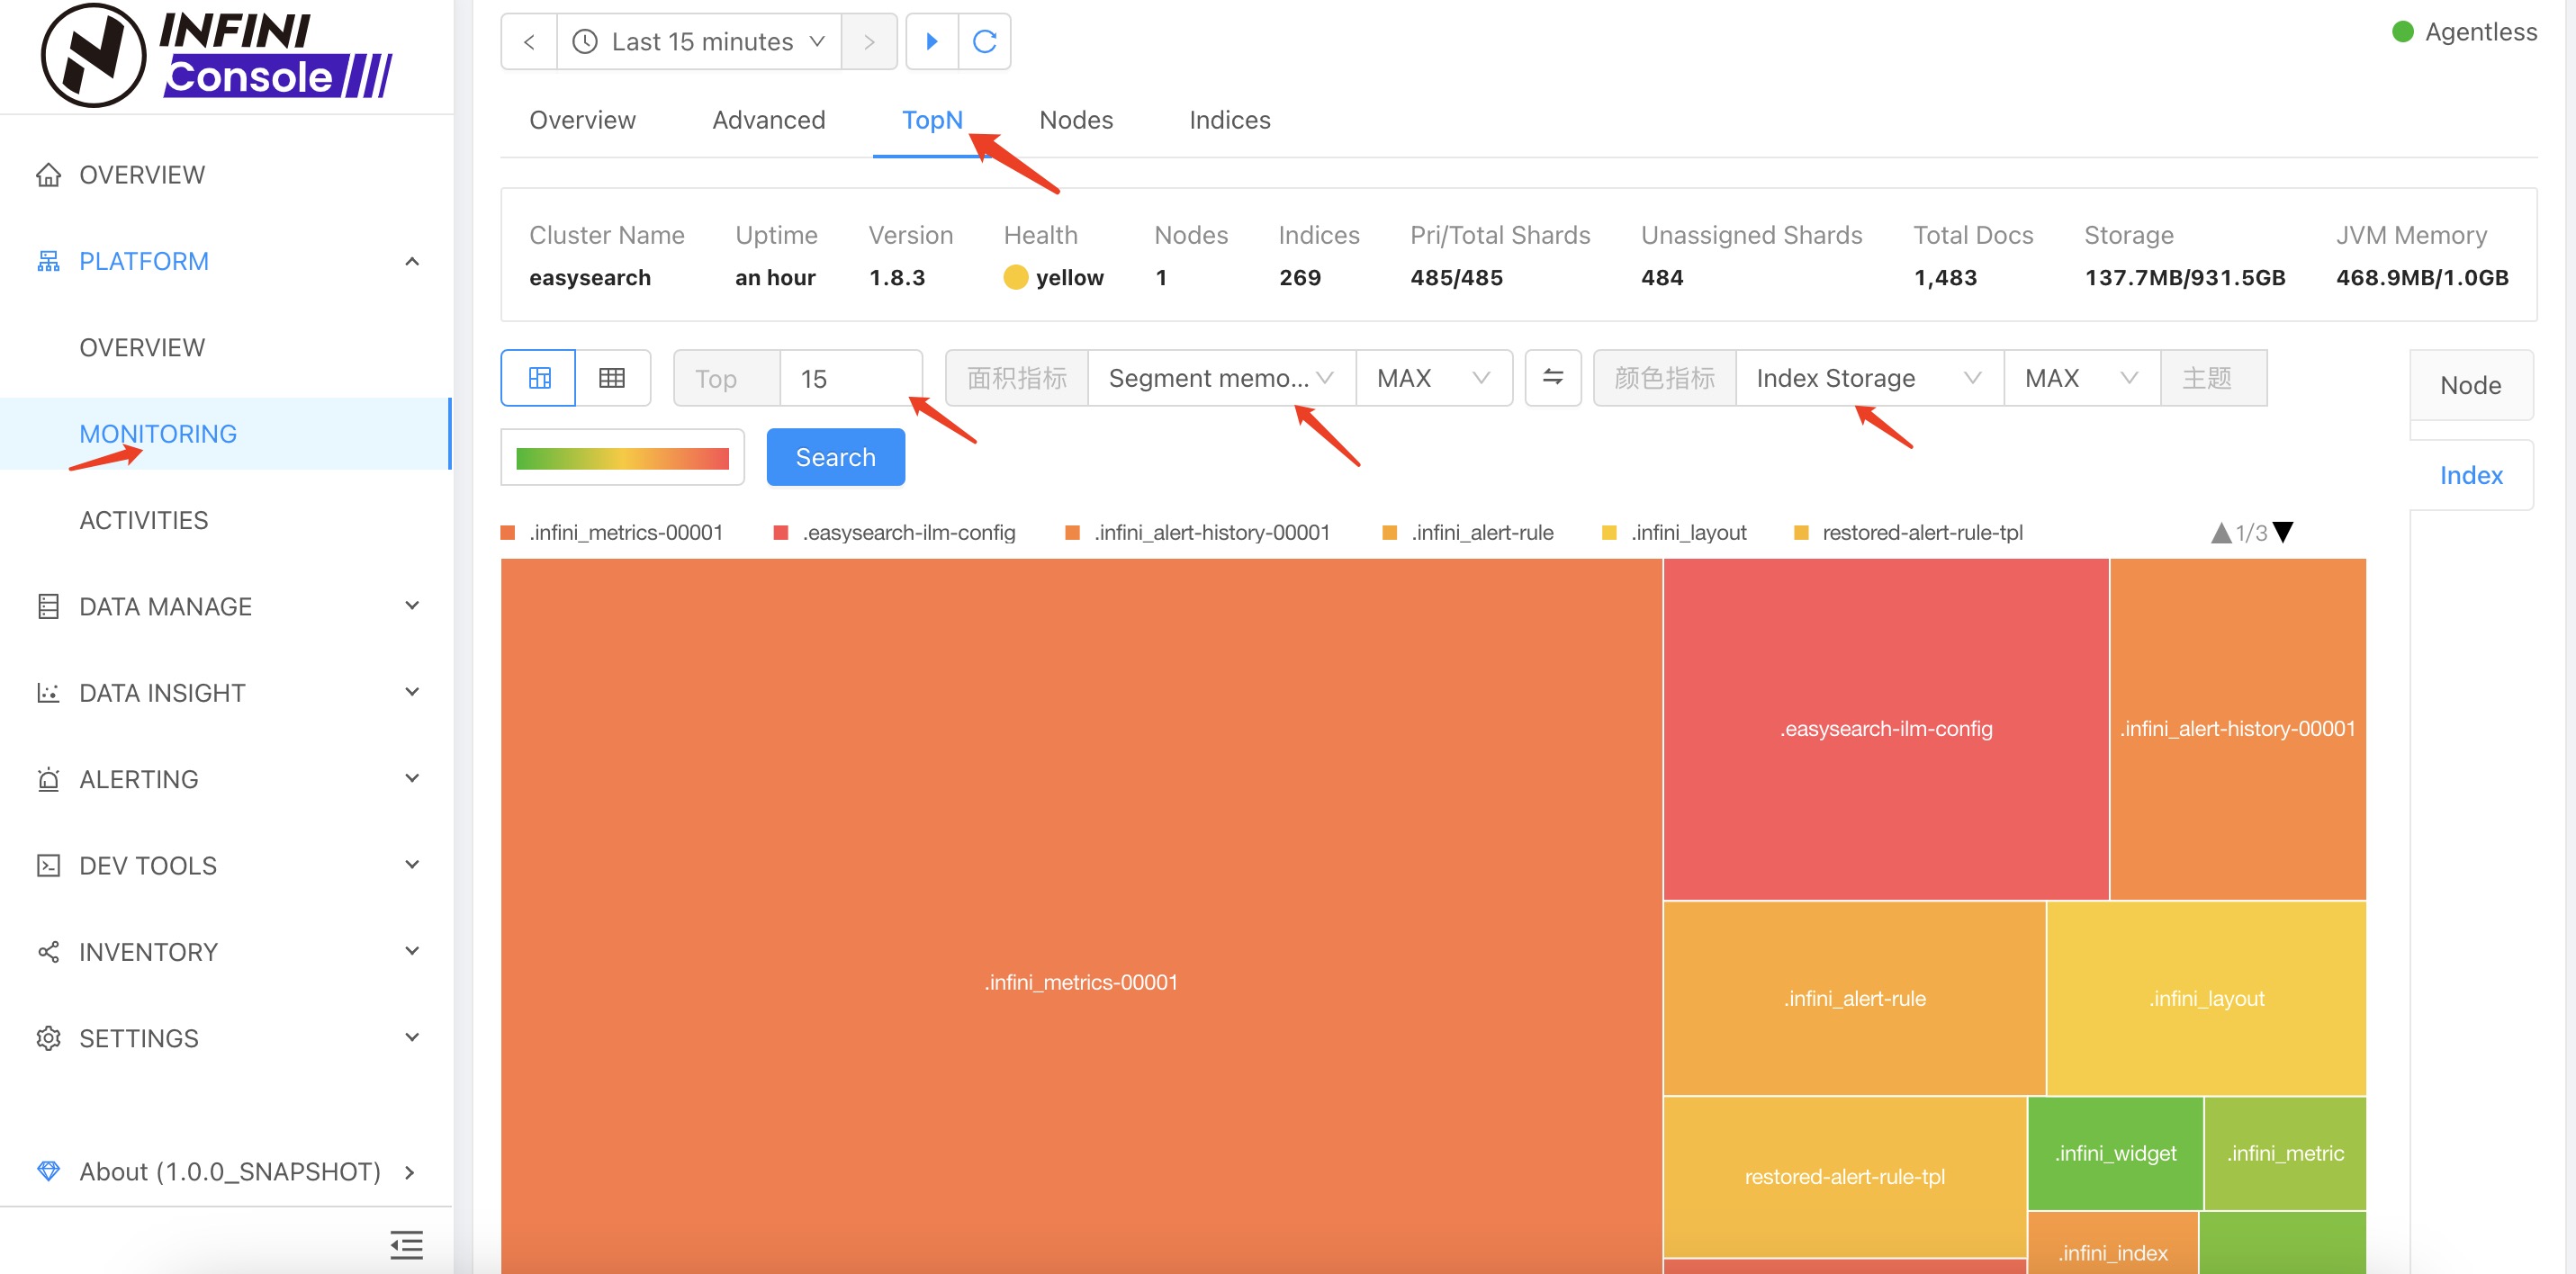
By default, TopN sorting uses the area metric. If you want to sort by the selected color metric instead, click the Swap button shown above.
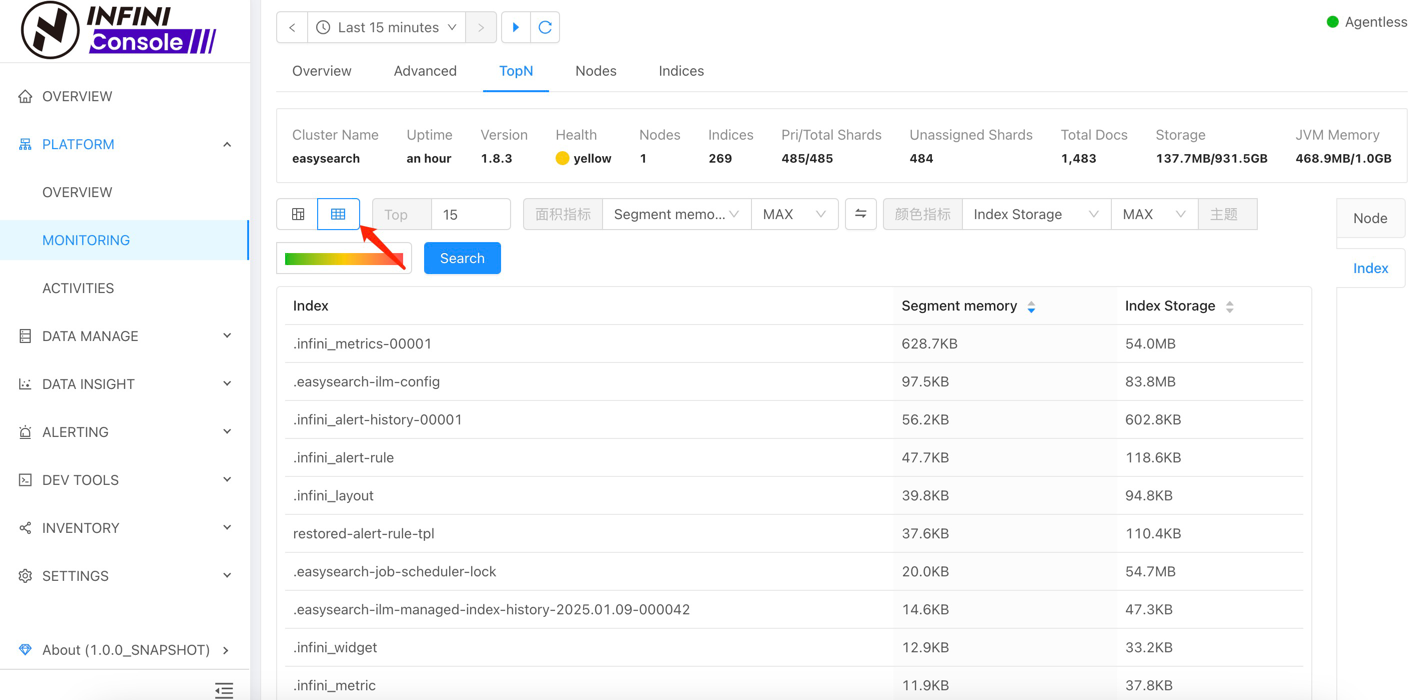
If you prefer a simplified view, you can switch to the table view, as shown below:
Summary #
The TopN metrics feature in INFINI Console enables users to perform performance monitoring and analysis more efficiently, especially when dealing with large numbers of nodes, indices, and shards. Through intuitive TopN sorting, users can quickly identify the most resource-consuming nodes, indices, or shards, helping detect bottlenecks early and apply timely optimizations. Whether for memory usage, CPU utilization, or index storage, the TopN feature provides a clear view to support intelligent resource allocation and continuous performance improvement.
As clusters scale, traditional monitoring methods may become cumbersome and inefficient. This new feature in INFINI Console enhances performance tuning and decision-making efficiency with a user-friendly interface and powerful multi-dimensional data analysis. In practice, users can configure it flexibly to focus on the most critical resource usage points in real time, enabling proactive measures to ensure system stability and performance.